
New to GIS Software?
If you're just getting started with GIS software, the options, data, styling and everything else involved can become very overwhelming. This tutorial won't go into any single topic in depth, but instead tries to cover a wide range of topics by providing resources and examples.
Software
The first choice you have to make is the software you're going to use. I have started using QGIS almost exclusively so my examples will focus on QGIS but various software packages operate quite similarly. If you run into troubles, just get in touch with us and we'll do our best to help. For a comparison of other software options read my post ArcGIS, QGIS and Tilemill for an overview on the similarities and differences.
Read about pgAdmin 4's fantastic new feature: geometry viewer!
TileMill has been discontinued and replaced by MapBox Studio. It still looks like great software, but the last time I tested MapBox Studio it would not connect using encrypted connections to PostGIS, and our databases require encryption.
Learning the QGIS User Interface
To learn about the basics of working with QGIS and spatial data, I would follow this tutorial. It will guide you along downloading some example data from the folks at Natural Earth, and working with the layers and generating an output file. The data file to download is roughly 160 MB which should give you and idea of how big spatial data is. That fact will be emphasized when you consider that data doesn't include much of the detail you likely want to work with, such as roads.
Install OpenLayers Plug-In
Once you've familiarized yourself with the user interface, I would recommend installing the OpenLayers plug-in for QGIS. Check out these quick instructions to install the plug-in. The OpenLayers plug-in allows using familiar thematic maps, such as OpenStreetMap.org, Google Maps, and more. The best thing with this plug-in is it allows you to simply add the supplemental data required for your custom map. Everything else is styled from OpenLayers. Without the plug-in, you would need to load and format every layer for every data element that needs to be displayed. Not only does this take a lot of time to setup, it can kill your GIS software's performance.
Add OpenStreetMap as a Background
With the OpenLayers plug-in installed, find "Web" in the menu and go to
OpenLayers plugin > OpenStreetMap > OpenStreetMap.
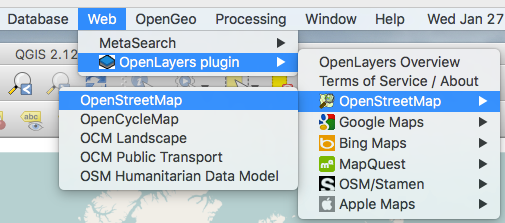
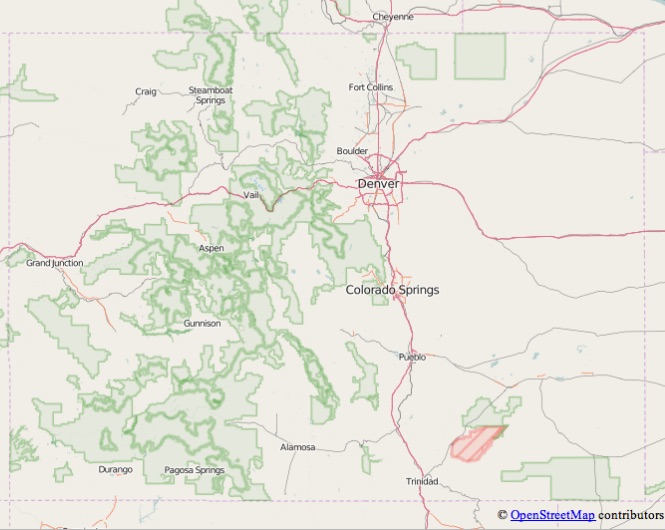
If you started with a new project you will see a view of the world from OpenStreetMap's Servers. Zoom in to the United States and you'll see more detail appear, just like on OpenStreetMap. Zoom in again to Colorado, and you should see something like the next screenshot. For comparison, feel free to check out Colorado at OpenStreetMap, you should see pretty much the same thing.
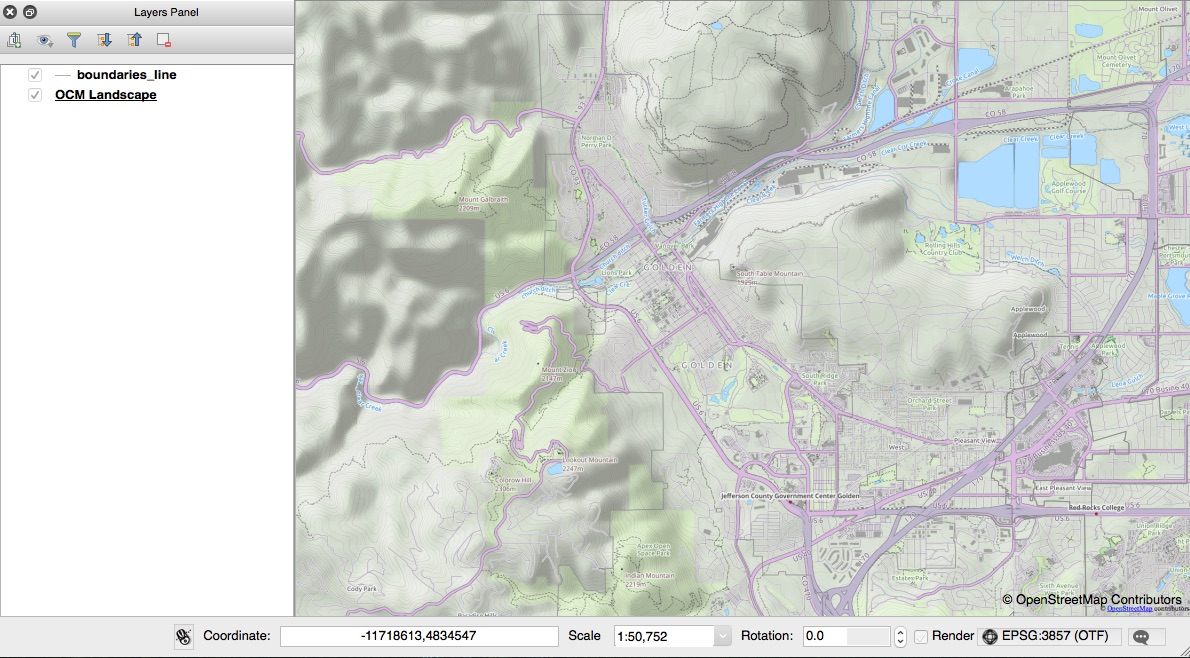
Go ahead and experiment with a few more layers from OpenLayers. My personal favorite theme is the OpenStreetMap OCM Landscape, which isn't a theme available on their website (at least that I've found). The next screenshot shows Golden, CO using that theme in QGIS. Outside of the OpenStreetMap themes provided there are also maps from Bing, Google and more.
Spatial Data is Big
As you work with GIS related data, you're come to realize how much data is involved. The initial data provided through RustProof Data is close to 1 GB. That's just Colorado with a small subset of the data I would like to include. No matter how you connect to the data, the bigger it gets... the slower it becomes.
If you are using PostGIS, see my PostGIS: Table Your Spatial data posts. Part 1 shows how to improve performance with large polygons, part 2 shows how to reduce many small objects.
This leads me to my next point: Only use the data required for your maps. Using the OpenLayers plug-in as described above is a giant step to reducing the amount of data you need to load in your GIS software. If you're curious about the size of data each layer contains and an estimate of time to fully render, check out this spreadsheet in Google Docs.
That document includes a few references for time to load various layers at two zoom levels: Colorado, and Golden, CO. The times shown were the time it took to fully render the layer from my MacBook Pro. This connection is through WiFi to our home DSL connection in rural Colorado. The server I'm connecting to server is in New York. Take all of those details into consideration when using my time estimates.
Zoom and Bookmark
Knowing that spatial data is big, how do you minimize those effects? The best way is to reduce the volume of data that's needed, which can be accomplished by zooming in as far as possible. When you zoom in, QGIS use what is called a bounding box to filter for data that falls within the frame you're viewing. Naturally, when you ask for less data the network and QGIS don't have to work as hard. This is especially important when requesting spatial data over a network, such as a remote PostGIS connection.
When you've focused in on an area you want to regularly work with, create a bookmark!
To create a new bookmark, simply use the menu View > Add Bookmark. This will
bring up the View Bookmarks menu and automatically create a bookmark at your
current position and zoom level. Having bookmarks saves you the hassle of loading lots of data
at a higher zoom, then fighting the zoom controls to get exactly where you want.
Styling GIS Data
Styling GIS data can be very tricky and time consuming. This is part of why our RustProof Data service includes default styling for most of the layers we provide. They aren't perfect yet, but they're far better than attempting to build your own styles from scratch for everything. Not only does the data need to have styles that match the category of data (building, interstate, sidewalks, trees, etc.), but to make the map functional the styles need to be modified to change based on the current zoom level.
Some resources for learning how to style data using QGIS:
Resources and Links
This post has provided a few high level concepts with plenty of existing resources to refer to for learning how to work with GIS software. Here are a few more links for continued reading, and if you have any specific questions feel free to contact us.
If you want to continue learning QGIS, there are a wealth of QGIS tutorials here. A couple of the links above come from this site. To see something neat I created with, check out my post on creating maps of Colorado's unemployment. It starts with a video at top, and goes through the technical details of how I made the maps including links to the data used. Here's another post that I wrote about some frustrations and revelations I've had about working with spatial data.
Hopefully this post has helped you get started on a path of making beautiful maps!
 Mastodon