
Pi 4 Performance: PostgreSQL and PostGIS
Happy Pi (π) Day! I decided to celebrate with another post
looking at the Raspberry Pi 4's
performance running Postgres and PostGIS.
A few months ago I added another Raspberry Pi to my collection,
the new Model 4 with 4 GB RAM. My
initial review
focused on pgbench results comparing the Pi 4 against the previous
3B models as well as the even lower-powered Raspberry Pi Zero W.
This post continues testing the Rasperry Pi 4's performance with
PostgreSQL and PostGIS, this time with a look at a more suitable
setup for production use cases.
The main difference are the use of an external SSD drive and
full-disk encryption.

Hardware and Configuration
The Raspberry Pi 4 is mounted in an enclosed Cana Kit case with a small fan in the top running on the 3.3 V rail (lower power), powered by a dedicated 3.5A power supply.
The internal SD card is a 32 GB A1 rated SD card. With the Pi 4 you need the fan (see Baked Pi) and the application-class SD card to reach and maintain the best performance. This core setup from CanaKit costs around $100 at the time of writing. The SSD drive used is a SanDisk 500GB Extreme Portable SSD ($90) that can take advantage of the Pi's two (2) newly available USB 3 ports. That SSD claims 550 MB/s so so should be faster than what the Pi can handle, this benchmark showed 363 MB/s read, 323 Mb/s write was possible by the Pi.
Postgres configuration
The latest versions of Postgres (12.2) and PostGIS (3.0.1)
were installed from source on Rasbian Buster Lite,
read this post
for an overview of that process. The data directory for our
Postgres instance is created on the SSD instead of the Pi's
internal SD card. This can be defined during the initdb and
startup steps, or moved later via postgresql.conf.
initdb -D /mnt/ssd/pgsql/data
pg_ctl -D /mnt/ssd/pgsql/data -l logfile start
My end goal for this Pi 4 is to use it as one of my local development
PostGIS servers. The configuration changes I make in
postgresql.conf are with that goal in mind. I'm leaving
max_parallel_workers_per_gather=2
(per results here),
disabling Just-in-Time
(see Postgres: JIT),
and bumping up memory values for shared_buffers and work_mem.
I always use TLS to encrypt connections and
am using the
new ssl_min_protocol_version
to limit protocols.
shared_buffers = 1GB
work_mem = 50MB
jit = off
checkpoint_timeout = 120min
checkpoint_completion_target = 0.9

ssl = on
ssl_cert_file = '/etc/ssl/certs/my-cert.pem'
ssl_key_file = '/etc/ssl/private/my-cert.key'
ssl_prefer_server_ciphers = on
ssl_ecdh_curve = 'prime256v1'
ssl_min_protocol_version = 'TLSv1.2'
Full Disk Encryption
Now that it is realistic to setup a Pi with external storage, said external storage can (and should!) be encrypted. The SSD I am using is setup with full disk encryption (FDE) using LUKS. This can be accomplished quite easily. Encryption is great for security though it does come at a cost. This benchmark showed FDE has a 20% hit on disk performance. I figured this was worth mentioning since this is a post about performance, after all.
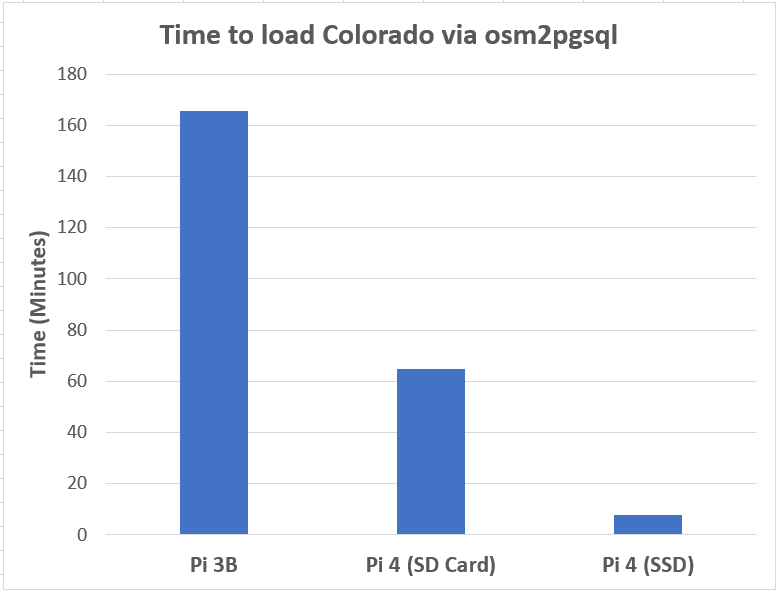
Performance Test: Bulk data load
The first place I test performance is typically with bulk data loads via osm2pgsql. I wrote about this with the Raspberry Pi 3B last year, and found that Colorado loaded in about 2 hours and 45 minutes. The Raspberry Pi 4 can do the same on with the SSD in 7.9 minutes, 95% faster! An additional detail to note is the file size of the Geofabrik export for Colorado has grown by 14%, from 167 MB to 191 MB over the past 14 months.
See my recorded session loading to PostGIS with osm2pgsql, or read the updated blog post to learn more about the osm2pgsql process.
PGBench TPC-B (sort of)
I previously found the Pi 3B could reliably hit 200 TPS. Running the same TPC-B (sort of) benchmark on this Pi 4 setup gets 570 TPS (+185%)
transaction type: <builtin: TPC-B (sort of)>
scaling factor: 10
query mode: simple
number of clients: 10
number of threads: 2
duration: 3600 s
number of transactions actually processed: 2053621
latency average = 17.514 ms
latency stddev = 7.212 ms
tps = 570.443363 (including connections establishing)
tps = 570.445788 (excluding connections establishing)
PGBench Custom Reporting
The built-in pgbench tests show one perspective, though it isn't all that similar to many common workloads. A custom pgbench test can help show a more realistic perspective for your workload. Read this post for more details, I use the same process outlined in that post.
The initial wide open reporting test was ran for 10 minutes to get a baseline for these queries. This showed an all-out rate of nearly 16 TPS for the three reporting queries. On the Pi 3B this test topped out at roughly 6 TPS; the Pi 4 with full disk encryption on an external SSD provides a 167% improvement. Another win!
pgbench -c 10 -j 2 -T 600 -P 60 -s 2 \
    -f tests/reporting1.sql \
    -f tests/reporting2.sql \
    -f tests/reporting3.sql \
    bench_test
Snippet from results:
...
duration: 600 s
number of transactions actually processed: 9477
latency average = 633.449 ms
latency stddev = 665.079 ms
tps = 15.779909 (including connections establishing)
tps = 15.780174 (excluding connections establishing)
...
Throttled test
I will also revisit the throttled rate test I did in the prior post. The goal with this approach is to determine the threshold of where performance, a measurable quality metric, breaks down. With the Pi 3B, the following command was enough to cause noticable numbers of late (2.6%) and skipped (0.5%) queries.
The Pi 4, however, handles this with ease with zero skipped queries and only 1 of 612 coming in too slow (>500ms). The timing results show a latency average of 159ms (vs. 238ms) and a standard deviation of 89ms (vs 144ms). We want both of these numbers to be lower and the Pi 4 delivers.
pgbench -c 1 -j 1 -T 600 -P 30 -s 2 \
    -R 1 -r --latency-limit=500 \
    -f tests/reporting1.sql \
    -f tests/reporting2.sql \
    -f tests/reporting3.sql \
    bench_test

...
number of transactions actually processed: 612
number of transactions skipped: 0 (0.000 %)
number of transactions above the 500.0 ms latency limit: 1/612 (0.163 %)
latency average = 159.270 ms
latency stddev = 89.459 ms
rate limit schedule lag: avg 17.318 (max 315.268) ms
tps = 1.020003 (including connections establishing)
tps = 1.020036 (excluding connections establishing)
I pushed this test with --latency-limit fixed at 500ms up through
12 clients/TPS.
The Pi 4 handles this increased level of activity
far better than the Pi 3B handled 1 TPS. Even at 12 TPS there
were zero skipped queries and 17% of queries were "slow."
number of transactions actually processed: 7137
number of transactions skipped: 0 (0.000 %)
number of transactions above the 500.0 ms latency limit: 1231/7137 (17.248 %)
latency average = 306.024 ms
latency stddev = 379.891 ms
rate limit schedule lag: avg 0.842 (max 363.135) ms
tps = 11.889196 (including connections establishing)
tps = 11.889424 (excluding connections establishing)
Increase Performance Threshold
The above tests outperformed the benchmark set by the Pi 3B. With
the improved query performance on the Pi 4, I decided to
increase quality expectations (--latency-limit) from 500 ms to 250 ms.
The following table shows the results for latency, standard deviation,
% late and % skipped. Results are included for a target Client/TPS count
of 3 through 16.
| Clients / TPS | Latency | StdDev | Late % | Skipped % |
|---|---|---|---|---|
| 3 | 150 | 102 | 20.0% | 0.2% |
| 8 | 184 | 174 | 25.0% | 0.2% |
| 10 | 229 | 244 | 29.0% | 0.4% |
| 12 | 316 | 364 | 38.0% | 1.0% |
| 14 | 392 | 473 | 43.0% | 1.4% |
| 16 | 662 | 774 | 67.0% | 7.0% |
pgbench OpenStreetMap
A while back I added a couple scripts under an OpenStreetMap folder in my tests repo. The first uses the data from the table structure created by osm2pgsql. In this original form, the 250ms quality is too high of a bar. The average query latency comes in at 578ms and 15% of the transactions were skipped.
pgbench -c 4 -j 2 -T 600 -P 30 -s 2 \
    -R 4 -r --latency-limit=250 \
    -f tests/openstreetmap/osm--co-jeffco-trees-benches.sql \
    pgosm

transaction type: tests/openstreetmap/osm--co-jeffco-trees-benches.sql
scaling factor: 2
query mode: simple
number of clients: 4
number of threads: 2
duration: 600 s
number of transactions actually processed: 2100
number of transactions skipped: 378 (15.254 %)
number of transactions above the 250.0 ms latency limit: 2100/2100 (100.000 %)
latency average = 578.368 ms
latency stddev = 179.850 ms
rate limit schedule lag: avg 22.379 (max 248.092) ms
tps = 3.498242 (including connections establishing)
tps = 3.498356 (excluding connections establishing)
Data structure is important
In my talk PostGIS Queries and Performance I cover
the importance of the data structure and its impact on performance.
The second query in the tests/openstreetmap folder runs an
equivalent query that returns the same results,
but uses the structure created by
PgOSM.
The results using the restructured data are more impressive and well
within the quality expectations.
pgbench -c 4 -j 2 -T 600 -P 30 -s 2 \
    -R 4 -r --latency-limit=250 \
    -f tests/openstreetmap/pgosm--co-jeffco-trees-benches.sql \
    pgosm

transaction type: tests/openstreetmap/pgosm--co-jeffco-trees-benches.sql
scaling factor: 2
query mode: simple
number of clients: 4
number of threads: 2
duration: 600 s
number of transactions actually processed: 2423
number of transactions skipped: 0 (0.000 %)
number of transactions above the 250.0 ms latency limit: 0/2423 (0.000 %)
latency average = 67.341 ms
latency stddev = 24.611 ms
rate limit schedule lag: avg 0.856 (max 104.765) ms
tps = 4.038397 (including connections establishing)
tps = 4.038486 (excluding connections establishing)
Summary
This post has reviewed the Raspberry Pi 4's performance and ability to handle my Postgres and PostGIS workloads. I'm impressed at the improvements in numbers that I am seeing from pgbench. I'll give it a try to see how it handles my regular local use cases including exploring with QGIS. Stay tuned!
Need help with your PostgreSQL servers or databases? Contact us to start the conversation!
 Mastodon