
PostgreSQL performance on Raspberry Pi, Reporting edition
In a previous post I documented
PostgreSQL's performance on the Raspberry Pi 3B
over multiple versions of Postgres. There I used the standard TPC-B (sort of)
tests included with pgbench that try to run as fast as possible. That's reasonable
from a certain perspective, but falls short from helping to decide how much
hardware you really need.
This post is part of the series PostgreSQL: From Idea to Database.
This post puts Postgres on the Pi under a more realistic workload (for me) and explains
how I approached the task. For this post I'm using Postgres v11.2 for all tests and using
three Raspberry Pi's for the testing. The configuration for Postgres is the same
as the prior post and the only Postgres-specific tuning I do in this post is on
max_parallel_workers_per_gather. That brings me to by secondary goal with this post,
do a better job finding where PostgreSQL's parallel query feature
works well, and where it can hurt performance. Parallel query was introduced in Pg 9.6 and has improved with each subsequent version.
My example workload
My Postgres-Pis are all disposable and easy to rebuild. I have a standard image
created that I can flash to an SD card, run an Ansible deployment or two, and
the Pi is setup for whatever I want it to do.
Much of my querying is from a reporting/analytical perspective.
This means I'm using wider tables with multiple data types, indexes, joins,
and aggregations. Not tiny SELECT, UPDATE and INSERT queries.
Another difference is my Pi database servers aren't constantly bombarded at these high rates of connection. A lot of databases are idle much of the time (gasp) with occasional use by a handful of users in short bursts. Especially with a Raspberry Pi, I see those as "developer machines." They're cheap enough that each developer can have a rack (seriously, $250 for a rack of 4...) and they perform well enough, along with automation, that makes them seriously useful.
Luckily, pgbench gives us everything we need to change up our testing scenario
a different workload in mind.
Setting up for Tests
I created a new GitHub repo to make these tests easy to share and reproduce. Tests for this post used commit 2fe73bf.
Switch to the postgres user and setup for the tests.
sudo su - postgres
mkdir ~/git
cd ~/git
git clone https://github.com/rustprooflabs/pgbench-tests.git
cd pgbench-tests
Custom initialization
Create the bench_test database and initialize it with the reporting tables.
We need to use psql to seed the database instead of pgbench.
With custom tests, we have custom tables and data loading too. For the
Pi I use scale=2 to load the pgbench_reporting table with 200,000 rows.
createdb bench_test
psql -d bench_test -f init/reporting.sql -v scale=2
This creates a bench_test database with three tables. The main table being
pgbench_reporting. Using a scale of 2 on this custom data set seeds 200,000 rows
taking up a little under 40MB on disk.
psql -d bench_test -c "\dt+"

                           List of relations
┌────────┬───────────────────┬───────┬──────────┬───────┬─────────────┐
│ Schema │       Name        │ Type  │  Owner   │ Size  │ Description │
╞════════╪═══════════════════╪═══════╪══════════╪═══════╪═════════════╡
│ public │ pgbench_lookup1   │ table │ postgres │ 48 kB │             │
│ public │ pgbench_lookup2   │ table │ postgres │ 48 kB │             │
│ public │ pgbench_reporting │ table │ postgres │ 37 MB │             │
└────────┴───────────────────┴───────┴──────────┴───────┴─────────────┘
(3 rows)
Looking closer at the pgbench_reporting table there are a few types of data, foreign
key constraints and indexes added to the foreign key columns.
bench_test=# \d pgbench_reporting
             Table "public.pgbench_reporting"
┌────────┬──────────────┬───────────┬──────────┬─────────┐
│ Column │     Type     │ Collation │ Nullable │ Default │
╞════════╪══════════════╪═══════════╪══════════╪═════════╡
│ id     │ bigint       │           │ not null │         │
│ d1     │ text         │           │          │         │
│ fk1    │ bigint       │           │ not null │         │
│ fk2    │ bigint       │           │ not null │         │
│ v1     │ numeric(8,4) │           │          │         │
│ v2     │ integer      │           │          │         │
│ d2     │ text         │           │          │         │
└────────┴──────────────┴───────────┴──────────┴─────────┘
Indexes:
    "pk_pgbench_reporting" PRIMARY KEY, btree (id)
    "ix_pgbench_reporting_fk1" btree (fk1)
    "ix_pgbench_reporting_fk2" btree (fk2)
Foreign-key constraints:
    "fk_pgbench_reporting_fk1" FOREIGN KEY (fk1) REFERENCES pgbench_lookup1(id)
    "fk_pgbench_reporting_fk2" FOREIGN KEY (fk2) REFERENCES pgbench_lookup2(id)
This structure is intended to simulate common types of tables seen often "in the wild" of production databases.
View for test queries
The initialization script above also created a view named pgbench_view used
for the tests.
This handles the joins to use the foreign keys defined on the base table,
the added columns are aliased as fk1data and fk2data.
\d pgbench_view
                View "public.pgbench_view"
┌─────────┬──────────────┬───────────┬──────────┬─────────┐
│ Column  │     Type     │ Collation │ Nullable │ Default │
╞═════════╪══════════════╪═══════════╪══════════╪═════════╡
│ id      │ bigint       │           │          │         │
│ d1      │ text         │           │          │         │
│ fk1     │ bigint       │           │          │         │
│ fk1data │ text         │           │          │         │
│ fk2     │ bigint       │           │          │         │
│ fk2data │ text         │           │          │         │
│ v1      │ numeric(8,4) │           │          │         │
│ v2      │ integer      │           │          │         │
│ d2      │ text         │           │          │         │
└─────────┴──────────────┴───────────┴──────────┴─────────┘
Test queries
I used three queries for this testing
(one,
two,
three).
While pgbench allows you to weight these queries I decided to keep all weights
equal to start with.
The first query (tests/reporting1.sql)
calculates a few aggregates grouped by fk1 and fk1data.
SELECT fk1, fk1data,
    COUNT(*) AS cnt,
    AVG(v1) AS v1avg,
    MAX(v2) AS v2avg
FROM pgbench_view
GROUP BY fk1, fk1data
;
The
plan from EXPLAIN ANALYZE with
max_parallel_workers_per_gather = 2 (default in Pg11) shows that Postgres does
decide to use Parallel for this query. This indicates our setting here
could help or hurt performance.
...
Workers Planned: 2
Workers Launched: 2
...
    Sort Method: quicksort  Memory: 19kB
    Worker 0:  Sort Method: quicksort  Memory: 19kB
    Worker 1:  Sort Method: quicksort  Memory: 19kB
...
The TCP-B (sort of) tests do not benefit/hurt from parallel queries as of Pg11. (At least not on the Pi!)
Testing full speed
First I ran pgbench for 1 hour with 10 clients and my three new queries.
This had the result of 5-6 TPS on nearly any configuration.
This was frankly rather boring.
pgbench -c 10 -j 2 -T 3600 -P 60 -s 2 \
    -f tests/reporting1.sql \
    -f tests/reporting2.sql \
    -f tests/reporting3.sql \
    bench_test
Note: These tests used non-app rated SD cards. See my post on SD cards for more details.
Customizing pgbench
I want to pull back on the rate of execution to see what is reasonable to expect
from Postgres on a Pi for a single-user.
I don't expect this user to be hitting F5 (execute query) as fast as machine-possible
either. We've already tried that, now lets see what happens when things are made
more realistic for this tiny hardware.
To do this, I need to define my quality expectations for performance.
Let's say I want to run one query once per second and I expect full results
in 500ms or less (e.g. latency, or lat).
This definition can now be translated to pgbench using a couple new options.
Adding -R 1 -r --latency-limit=500 to the pgbench command should achieve these results.
The option -R 1 sets the target rate at 1 TPS and
--latency-limit=500 sets the performance threshold at 500ms.
Performance of your database is a quality metric. The trick for planning is to translate between user expectations and our testing methodology.
pgbench -c 1 -j 1 -T 3600 -P 30 -s 2 \
    -R 1 -r --latency-limit=500 \
    -f tests/reporting1.sql \
    -f tests/reporting2.sql \
    -f tests/reporting3.sql \
    bench_test

...
progress: 330.0 s, 0.8 tps, lat 216.944 ms stddev 144.121, lag 15.872 ms, 0 skipped
progress: 360.0 s, 1.1 tps, lat 257.683 ms stddev 155.640, lag 45.778 ms, 1 skipped
progress: 390.0 s, 1.2 tps, lat 208.859 ms stddev 130.061, lag 21.272 ms, 0 skipped
progress: 420.0 s, 1.0 tps, lat 260.450 ms stddev 141.157, lag 45.121 ms, 1 skipped
progress: 450.0 s, 1.2 tps, lat 253.322 ms stddev 171.986, lag 56.560 ms, 0 skipped
...
number of transactions actually processed: 611
number of transactions skipped: 3 (0.489 %)
number of transactions above the 500.0 ms latency limit: 16/611 (2.619 %)
latency average = 237.988 ms
latency stddev = 144.305 ms
rate limit schedule lag: avg 32.037 (max 462.121) ms
...
Note: Setting clients (
-c) higher than than TPS rate limits (-R) limits all clients to the defined rate. This probably only matters on tiny hardware!
The pgbench output now provides information about "slow" and "skipped"
queries in the summary.
In this test case, 0.5% were skipped and 2.6% of the queries took longer than 0.5 seconds to execute.
number of transactions skipped: 3 (0.489 %)
number of transactions above the 500.0 ms latency limit: 16/611 (2.619 %)
Skipped transactions are explained in the docs:
"If --latency-limit is used together with --rate, a transaction can lag behind so much that it is already over the latency limit when the previous transaction ends, because the latency is calculated from the scheduled start time. Such transactions are not sent to the server, but are skipped altogether and counted separately.""
Test Results
Now for the results from the bulk of the testing.
All tests were ran for 1 hour (-T 3600) and most of them were ran at least twice
on multiple Pis. The "# of Clients" (N) is controlled by setting both clients (-c N)
and rate (-R N) via pgbench. For these purposes, this simulates each client attempting to achieve 1 TPS. The "Testing full speed" section above
found that these queries on this hardware will max out at 5-6 TPS so I tested
below and above those limits (1-8) for number of clients.
I didn't test 3 or 7 clients because I didn't expect them to provide meaningful insight.
The only PostgreSQL-specific parameter
controlled for in these tests was max_parallel_workers_per_gather, all other
Postgres configurations are as documented in
my prior post with nearly all
configurations at their defaults.
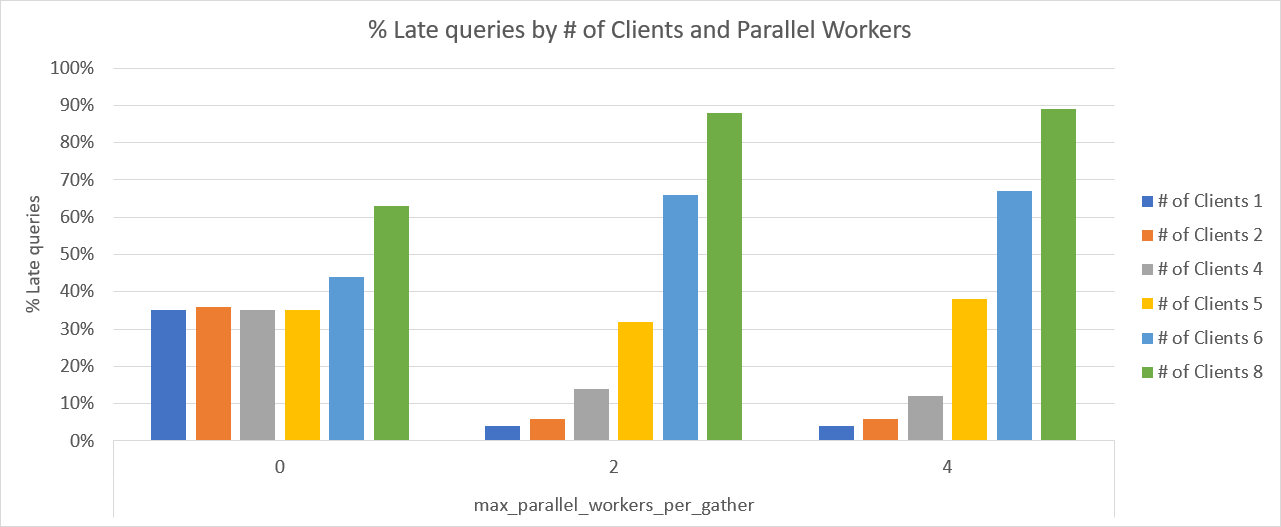
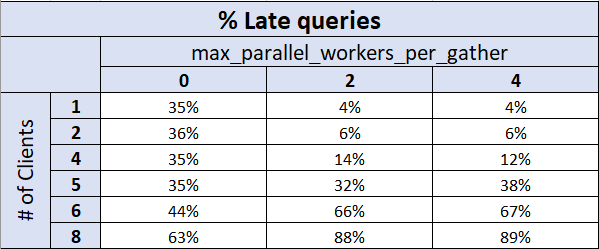
Late queries
The following chart and table show the percentage (%) of late queries. In other words,
how many queries took longer than the target 500ms execution time?
With max_parallel_workers_per_gather = 0 these queries didn't perform as hoped more
than 1/3 of the time. The good news is, performance was
consistent up through 5 clients (read: predictable). Performance really starts to drop off with 6 or more clients; by 8 clients about 2/3 queries were slow.
With max_parallel_workers_per_gather set at either 2 or 4 (the Pi has 4 cores),
and 1 or 2 clients, well under 10% of queries were slow. Performance was also
noticeably better with this setting at 4 clients than it was with the setting at 0.
Once the number of clients exceeds the number of cores, performance starts to drop off
for these queries.
At 6 clients, edging past the already known TPS limit for the hardware,
performance drops off a cliff with
max_parallel_workers_per_gather > 0. With 8 clients, nearly 90% of queries
perform poorly.
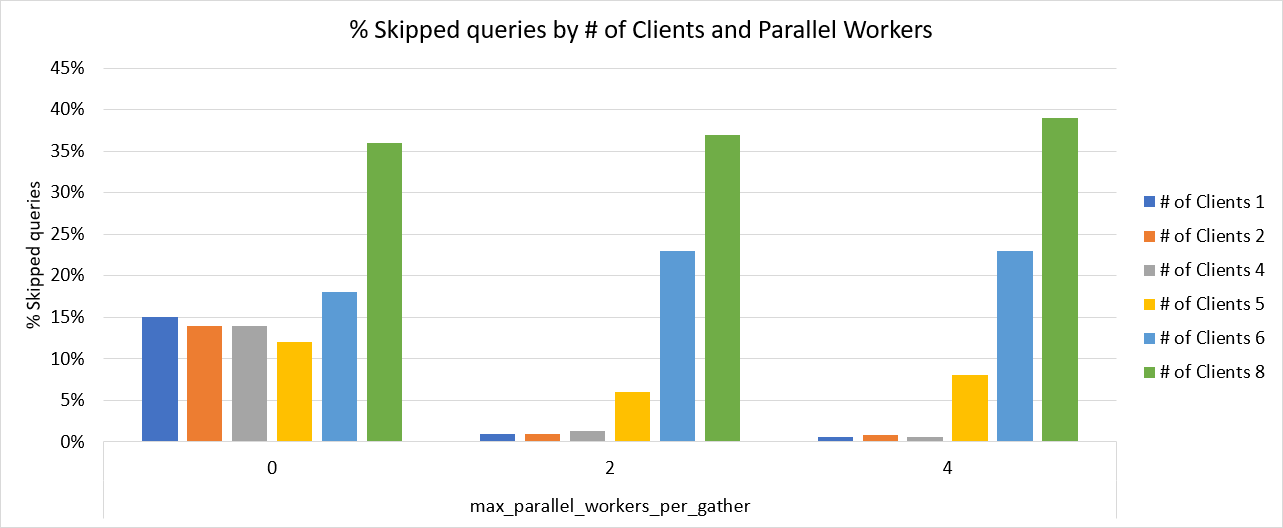
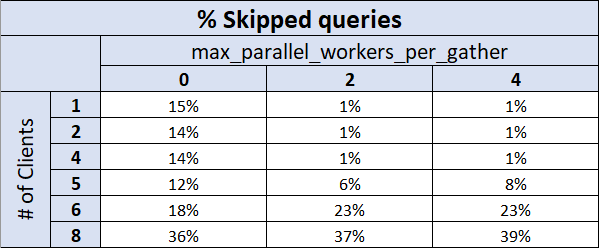
Skipped queries
The skipped transactions data shows similar results. Starting again
with max_parallel_workers_per_gather = 0, roughly 15% of queries were skipped
when the number of clients was 6 or less.
With 8 clients this failure rate spiked up to more than 1/3 being
skipped. With max_parallel_workers_per_gather set at either 2 or 4, the query skip rate
held at 1% or lower as long as the number of clients was lower than the number of cores.
Summary
I had two goals for this post, let's see how they worked out.
First, was to preform more realistic testing of PostgreSQL performance on the Pi for my workloads. I found the Raspberry Pi 3B is perfectly capable of good performance (as defined above) with analytical-ish queries on a database of modest size (200k rows) and a small (<= 4) number of concurrent users. Would I recommend this hardware for heavy-duty mission critical databases? No. (Why would you even consider that?) I don't use VirtualBox virtual machines on my laptop to power client databases either. But I do use them all the time for development, testing, and other non-critical use cases to enable the production systems. The Pi is no different here.
These results confirm my personal experience of using a Pi in this type of scenario.
Second, was to more thoroughly explore the thresholds
and limits of parallel query. Last year I did some initial testing of
parallel query performance on Pg10 and I wanted
closer look at that. The results in this post illustrate that in
some use cases parallel query can significantly help performance. That said, you need to
be careful with the number of simultaneous clients and the setting
of max_parallel_workers_per_query.
Testing and monitoring are your friends. No results I (or anyone) can publish can ever tell you how your data and your workload will perform on Hardware X.
Need help with your PostgreSQL servers or databases? Contact us to start the conversation!
 Mastodon