
From Idea to Database: Define, Design, Repeat
The database is one of the most critical components of most software projects. Planning for your database project should not be taken lightly. Failure rates in IT projects are unfortunately high; much of that problem is due to a lack of proper planning and design. Most of the database anti-patterns I previously wrote about can be avoided by understanding the system you need to build and designing it appropriately.
This post uses the PiWS project to illustrate the Define and Design approach I use throughout the initial development phases of any new database project. Most projects go through multiple iterations of define and design.
This post is part of the series PostgreSQL: From Idea to Database. This series uses the PiWS project for our example project, to read more about the PiWS, see my introductory post.
Project management, not optional
Anyone who has worked on a project with more than one person to design and build anything has heard this: "I forgot to tell you..." followed by some various change requirements. This could be something like adding a column to track eye color, or something major like calculating a zip code based on GPS coordinates.
Proper planning, design and consideration should always be done before writing code. This is especially important with databases; a database, unlike application code, cannot be simply "rebuilt" with new code. The data itself must be preserved, and that complicates the process.
Change requests will happen. You cannot stop this from happening, but by planning, designing, and asking questions up front you can reduce the frequency and severity of these events. Project management methodologies, such as Waterfall, Agile, and many others can provide a framework for managing your project.
Waterfall vs. Agile vs. Reality pic.twitter.com/wkiC4i8FA8
— Mario Fusco 🇺🇳🇪🇺 (@mariofusco) August 25, 2018
Define
In the early stages of a project, there's a vague idea about what data you are going to store but not much else. Someone on the team might have a few rough sketches, notes, or existing spreadsheets but these will only scratch the surface of the details required to develop a database. With the PiWS, I knew we needed to capture data from a wide variety of environmental sensors, store that data for a long time (years), and be able to run complex analytical queries on it (when is the first frost each year?).
The define stage is all about communication. You must be listening to your end users, taking notes about what they need/want this database to be able to provide. Now is the time for your end users to have a "wish-list" mentality to daydream about the best possible vision. When a database hasn't even been created yet, it's still easy to change!
Notes collected during the define phase will be used to drive the design process and kick-start the documentation for the database you are planning to build. Ask leading questions to see where you end up!
80% of getting the answer you need is about knowing how to ask the right question.
Collecting details from Q&A
The following following table outlines some example questions and answers that may occur at this time. Coming up with the right questions is not easy, so expect that you will not get them all in one try.
| Question | Answer |
|---|---|
| How will the data from the sensors come in to the database? | There's a Python program that receives the data from the sensors in real time and it needs somewhere to store the data. |
| How often is the data coming in? | Once every 5-15 seconds. |
| How many sensors will each PiWS have? | That depends. One goal for the PiWS is to be customizable and flexible. Right now we're planning on three sensors to start but would like to have 10 or more different sensors that could be connected. |
| What type of sensors are you working with? | Temperature, humidity, barometric pressure, wind speed.... |
| It sounds like those should have numeric values for their data? | Yes. |
What did we learn?
This Q&A oulined above provides a database developer with quite a few important details.
First, the data should be coming in using a consistent format over time. Next, sensor data could come in as often as once every five (5) seconds from at least three (3) different sensors. The the last important detail from the Q&A is that the data of interest (the readings from the sensors themselves) will be in numeric format.
With each sensor providing a reading every five (5) seconds that is 12 readings per minute, or 17,280 per day! With a default of three (3) sensors that is nearly 52,000 readings per day. This is not a tiny amount of data when you consider the target platform for the PiWS is, after all, a Raspberry Pi.
The Raspberry Pi's role is to collect the sensor observations from the Arduino board and store/transmit them for long-term storage and use. The Raspberry Pi can be either a quad-core Raspberry Pi 3B+ all the way down to a very affordable, single-core Raspberry Pi Zero W.
Naming Conventions
As a team you should decide on some basic naming conventions. Are
your table names singular
or plural? Do you use CamelCase? Or prefer_underscores?
Unless you MixAnd_match, I don't care too much what you do as long
as you and your team are consistent. Here are a few general guidelines
I recommend you follow.
- Be consistent
- Avoid built-in keywords
- Avoid special characters
- Avoid CAPS in object names in case-sensitive databases (such as PostgreSQL)
- Decide on either singular or plural object names
- Descriptive is better than cryptic
- Shorter names are better than longer names, unless the shorter name is cryptic
The most important thing is that as a team you decide on conventions and you try to be as consistent as possible. When inconsistencies are found, document them and work on a plan to normalize.
Design
After listening and note-taking, start formalizing your notes, thoughts, and assumptions into your initial design. This process starts by identifying the main tables for the database.
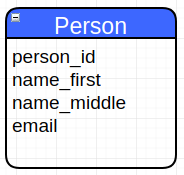
To help illustrate this in action, look at the following visual
representation of a basic
Person table. This provides a database developer enough details that
they could write
the code to build this table.
A diagram like this allows business users the ability to review what
the developer is thinking and planning. During a review process
the business user is likely to notice the developer has a
field for name_first and
name_middle but no name_last column.
Draw.IO is a great tool for quickly creating draft ERDs (entity-relationship-diagrams) during the design phase.
What makes a table?
How many columns should go into a table? I remember struggling with question, just how many columns should go into this table, and where should splits occur? One column doesn't make any sense and 1,000 columns is probably too many. Somewhere in the middle there has to be a sweet spot, right? Yes there is, and it depends on the expected use case. This is one of those areas where there's a fine line between science and art.
If the database is used in a transactional sense, keep the tables narrower where possible.
If the database is for reporting purposes, wider tables have their advantages.
Erik Darling's article
Do you have tables in your tables?
provides some additional guidance on the topic.
In our PiWS example, the main data
being tracked are being called "observations" so we have a
piws.observation table.
Add columns to tables
With your main tables identified, list the expected columns in each table. Make sure you list your primary keys for every table. Yes, the default should be that every table has a primary key. If you decide to build tables without primary keys, please explain your reasoning for not including one. Start defining data types where you know them so it becomes obvious which columns you still need more definition for. I can promise you this: You will not get all the details on the first, second or even third tries!
The design phase is well suited to white boards! They are collaborative and quick to update while brainstorming.
Define primary / lookup / relationships
Typically your primary tables are identified relatively quickly. Once the primary tables are solidifying it is time to identify relationships between the main tables and any lookup tables that may be necessary.
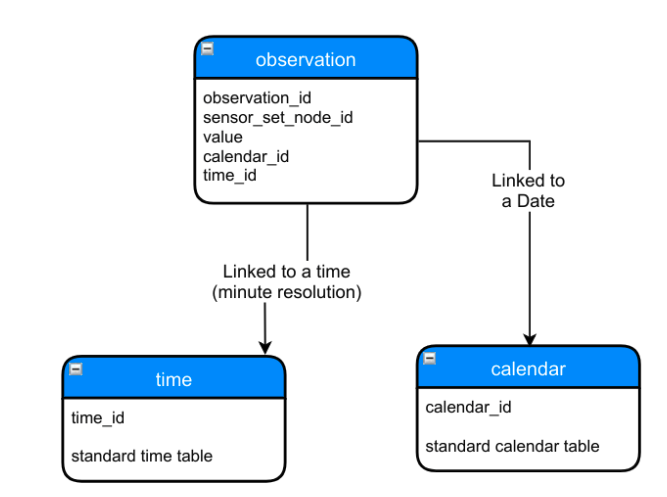
The following image shows a digram that was used to build the initial
structure for the PiWS database. As I mentioned earlier, the observation
table is going to be the main object. The other two tables here are lookup
tables providing links to dates (public.calendar) and times (public.time).
From here each table should be checked for critical elements of a relational database:
- Data types
- Primary keys (every table)
- Foreign keys
- NOT NULL constraints
Data dictionary
Now is the time to start building your data dictionary. Most columns should be given a description, even if it's purpose seems obvious right now. I like to start this part of the project by using a data dictionary template worksheet. Feel free to use our example data dictionary as a starting point for your project.
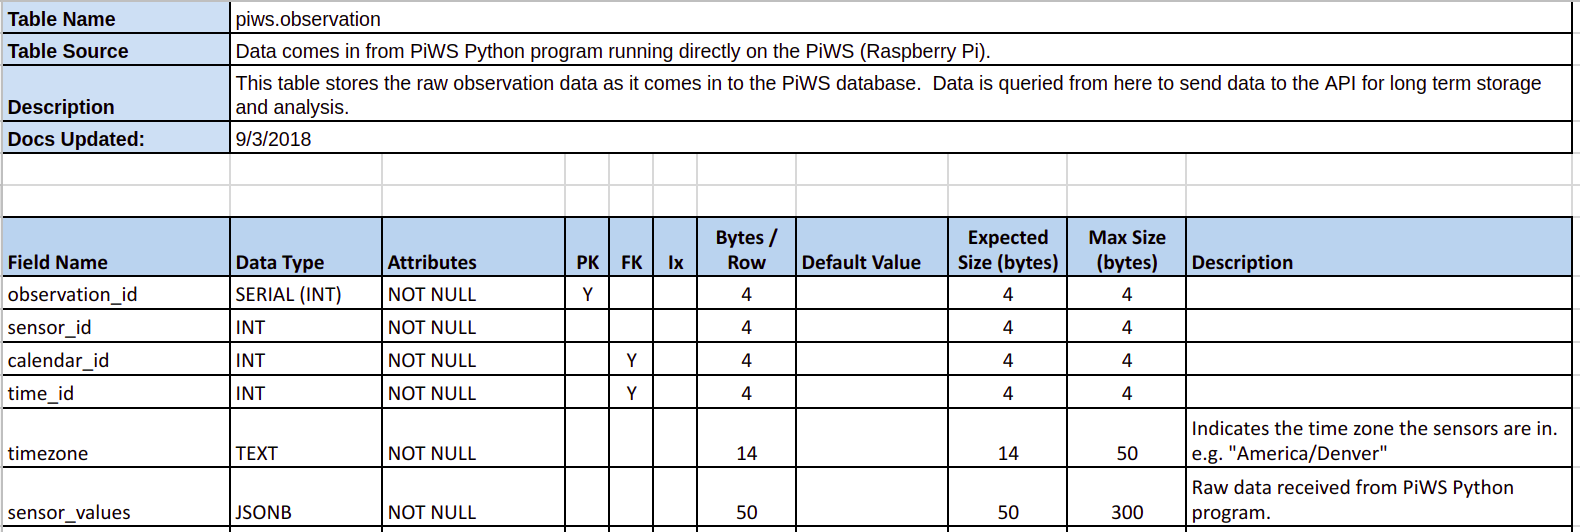
Our data dictionary layout uses one worksheet for each table. These worksheets are started by duplicating the existing "Template" worksheet. The top part of the worksheet has table level details, such as the name, where that table's data is sourced from, and a general description. Below the header information is a listing of the column details for the table. Each column has its own row to track data type, indicators for keys and indexes, a description, and more.
The following screenshot shows the data dictionary worksheet for the
piws.observation table.
As you build out your database objects, the easiest way to provide a data dictionary is directly within your database. I explore this topic in further depth in my post Build your Data Dictionary in PostgreSQL
Summary
This post has introduce some of the main concepts of the iterative Define and Design pattern I follow for building database driven systems. Databases are inherently complex, this process helps reduce the risk of developing these complex systems.
Communication and documentation are the heart of this process. Communicate with the users, ask questions, and document what they tell you. Then use that documentation to design what you think they need. Now repeat by using your initial designs to communicate with the end users to fill in missing pieces and confirm assumptions.
If you have questions, comments, or need help with your databases, contact us!
 Mastodon