PostgreSQL 10 Parallel Queries and Performance
Last week I was reviewing my list of topic ideas and I didn't feel like writing about any of them. So I headed to the PostgreSQL Slack Channel to ask for ideas. One of the great topic ideas was to explore the performance of PostgreSQL 10's improved Parallel Query feature and that sounded like a lot of fun, and something I should consider anyway. This feature was introduced in Pg 9.6 but has seen major improvements in the latest version.
April 2019 update: I put parallel query in PostgreSQL 11 to the test on the Raspberry Pi 3B. Check it out!
Parallel query is enabled by default in PostgreSQL 10 and is controlled through the configuration value for
max_parallel_workers_per_gather,
set to 2 by default.
To see more about configuring this feature, see this post.
Note: PostgreSQL changed their versioning policy with version 10.
Data for Testing
I decided to test this feature by loading the database of NOAA QCLCD weather data we've accumulated. There's about 10 years of daily weather observations in this database with that main table having nearly 4 million rows. This table is commonly joined to two tables, one storing the details about the weather station for each observation, the other linking to a calendar table.
A few million rows of data should be enough to put PostgreSQL's parallel queries to the test, while still small enough (only 206 MB on disk) to see if the feature will benefit smaller systems.
Common tasks with weather data often include "expensive" date and time calculations and aggregations. Calendar and time tables are essential to performance.
I've demonstrated with this data before to show off PostgreSQL's unlogged tables and a couple years before that when I compared PostgreSQL to PyTables.
Server Configurations
The existing PostgreSQL server is a small AWS instance with 1 core and 512 MB RAM running PostgreSQL 9.5. In reality the existing server is plenty powerful for our use case. This is mostly because the data is only updated occasionally and the refresh on the Materialized View takes under one minute. All real reporting is done based on that materialized view and queries run perfectly fast.
Yet, faster data is always fun so we move onward!
To test the Parallel Queries feature we need at least two cores. I created a new server with two (2) cores and
four (4) GB RAM. I installed vanilla (aka plain) PostgreSQL 10 with the default configuration including the default
max_parallel_workers_per_gather = 2 to enable parallel queries to take advantage of both cores.
The other PostgreSQL 10 configurations I tested used this same instance by varying this one parameter:
- Disable parallel queries:
max_parallel_workers_per_gather = 0 - Overclock attempt:
max_parallel_workers_per_gather = 4
Testing Methodology
Each query was executed a total of four (4) times on each server through the psql program at the command line.
The first query was not timed and was ran to make sure anything that can be cached would be for cached for the other
three (3) timed runs. The timed runs were executed with \timing enabled.
The timings I present in this post are the average of the three timings. The variance between individual timings was
under 5% on all but the most complex queries.
See more about caching and Postgresql here.
There are many factors that affect performance, and even the nature of using the \timing impacts the overall
performance. The only way to know for sure how this will work on your systems with your data is to test it.
I tested about 30 distinct queries and the results I'm not explicitly discussing in this post tell the same story.
Simple Queries
Let's get started with a few basic queries aggregating the 3.9 million rows in the daily table.
The code for the queries are below the following screenshot.
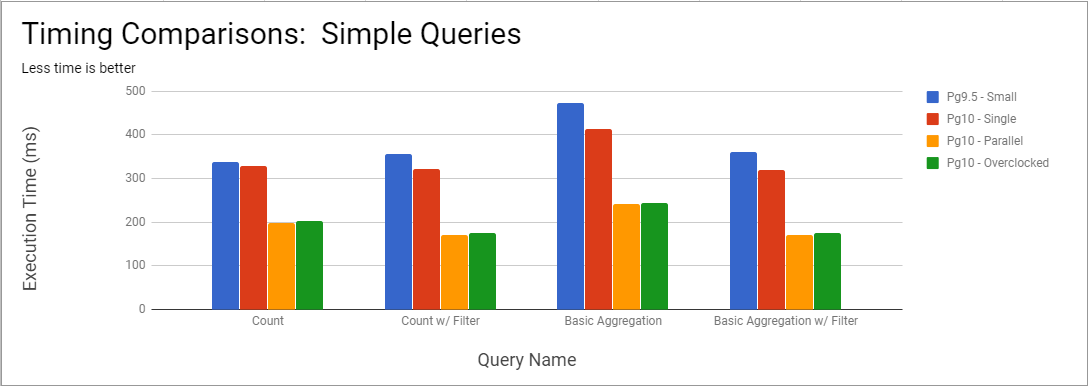
The orange bars show the server with parallel queries enabled performing the best across the board. The red bar is the real comparison that highlights the effect of enabling parallel queries.
-- Count
SELECT COUNT(*) FROM public.daily;

-- Count w/ filter
SELECT COUNT(*) FROM public.daily WHERE t_min < 0;

-- Basic Aggregation
SELECT AVG(t_min) FROM public.daily;

-- Basic Aggregation w/ Filter
SELECT AVG(t_min) FROM public.daily WHERE t_min < 0;
Initial Results
From these initial queries it's obvious that PostgreSQL 10 with parallel queries is faster than PostgreSQL 10 without parallel queries. There is a slight performance difference between PostgreSQL 9.5 and PostgreSQL 10 with parallel queries disabled. It's possible the more powerful EC2 instances is partly to credit, though I suspect the majority of this increase (3 - 13%) are representative of overall PostgreSQL performance improvements. That lines up with what Kaarel Moppel found when comparing Pg 9.6 to Pg 10 beta.
Just upgrading to PostgreSQL 10 gives you a performance increase.
You can see the saved query plans for the single threaded and the parallel query plan for the basic aggregation w/ filter query. This mostly confirms that it used two workers and a parallel sequence scan instead of a plain-ol' sequence scan. Single threaded it ran in 319 ms versus the parallel query version at 172 ms, or a 46% reduction in time.
Overclocked Server
Configuring PostgreSQL to allow 4 users for parallel queries (with only 2 cores available) caused the query planner to use 3 workers. This caused a slowdown in every query I tested, so will not be discussed further.
Warning: Setting
max_parallel_workers_per_gathergreater than the number of cores seems to cause a decrease in performance.
More complex example
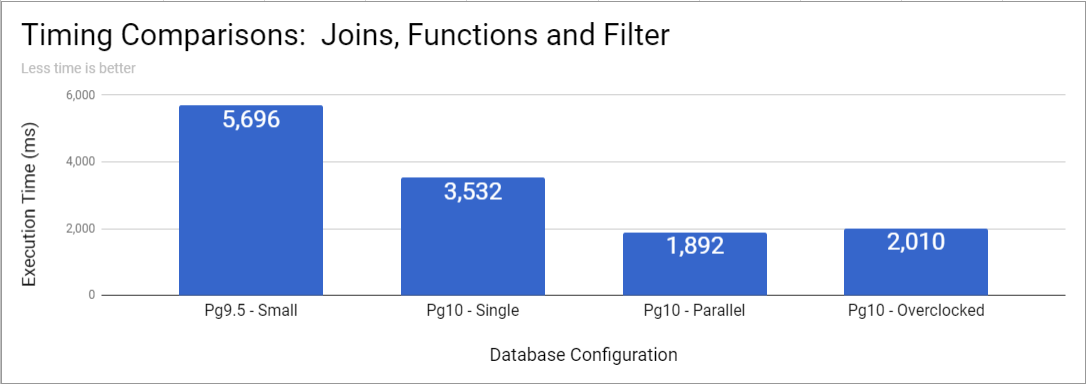
As queries I tested grew more complex, the performance gains from parallel queries increased in magnitude. In this complex example, parallel queries executed nearly 50% quicker than the single-threaded version.
SELECT s.station_id, c.calendarweek AS week_num,
        ROUND(AVG(d.t_min), 1) AS avg_t_min,
        ROUND(AVG(d.t_max), 1) AS avg_t_max,
        ROUND(MIN(d.t_min)::numeric, 1) AS min_t_min,
        ROUND(MAX(d.t_max)::numeric, 1) AS max_t_max
    FROM public.station s
    INNER JOIN public.daily d ON s.station_id = d.station_id
    INNER JOIN public.calendar c ON d.calendar_id = c.calendar_id
    WHERE d.t_min IS NOT NULL OR d.t_max IS NOT NULL
    GROUP BY s.station_id, c.calendarweek
;
Query Plans
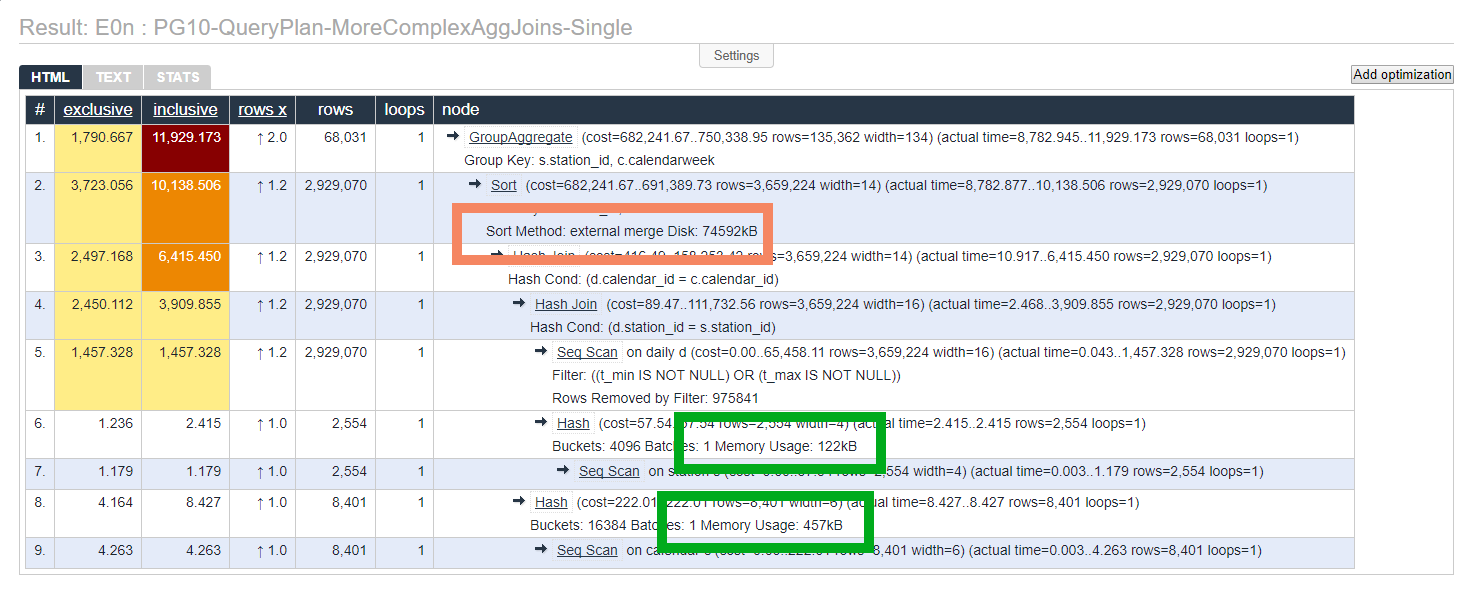
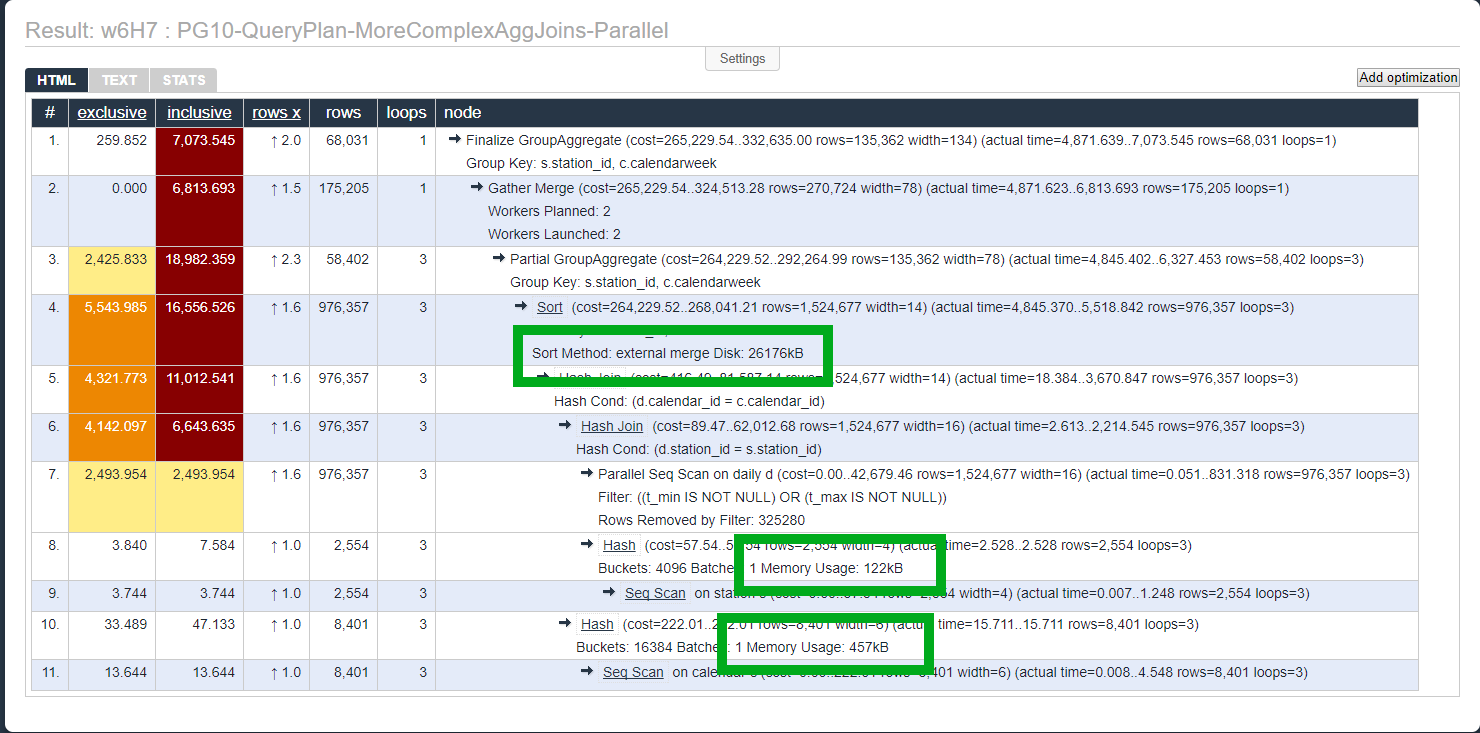
One performance bonus I didn't expect up front was that because the work is split into smaller chunks, sorts seem to be more likely to be handled in memory. This means less data gets dumped to disk and less disk I/O is a good thing.
This first screenshot (see the plan here) shows the plan when parallel queries was disabled. Notice it wrote almost 73 MB for the sort (organge box).
Now look at the plan for the parallel query. That's a 65% reduction in disk IO as the server handles the sort inside Partial GroupAggregate instead of standard GroupAggregate.
CPU Time
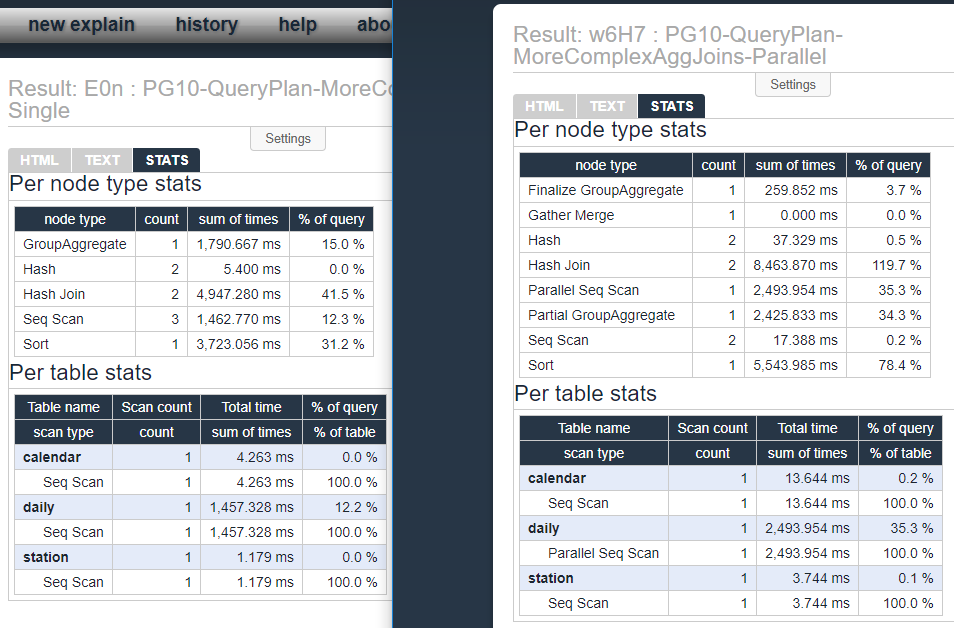
In the queries I tested I saw an increase in CPU time when parallel queries are enabled. This increase was in the range of 30 - 60% and seems roughly proportionally to the decrease in execution time. This seems to make sense, though I suspect the details are far more complicated if you looked at a wide range of queries and configurations.
The following screenshot shows the stats side by side of the query, the parallel verion is on the right. This shows a noticable increase in CPU time in order to provide the boost in performance for the end user!
Parting thoughts
Great job, PostgreSQL team! Parallel queries seems to deliver as promised with a reduction in execution time of 30-47% by doubling the number of processes running. I would suspect that doubling the number of cores again will provide similar increases to performance over the dual core setup, though there is likely some degree of diminishing returns due to switching costs and the cost of combining results. After all, nothing is free when it comes to performance!
My two main warnings are:
- Monitor your CPU load, number of connections, etc. before blindly adding this feature
- Don't set
max_parallel_workers_per_gathergreater than the number of cores available
Provided your PostgreSQL server has at least two cores, installing PostgreSQL 10 could greatly improve the performance of your queries.
This post is part of the series PostgreSQL: From Idea to Database.
Need help with your PostgreSQL servers or databases? Email us to start the conversation!
