
qgis2web to export and share interactive maps
QGIS is an open-source GUI for working with GIS data, both for spatial analysis and creating beautiful maps. One of my favorite components of QGIS is its qgis2web plugin that makes it quick and easy to convert a styled QGIS map into a browser-based slippy map that can be easily shared. qgis2web currently supports generating output in three (3) popular formats: OpenLayers, Leaflet, and MapBox GL JS. This post covers the basic process of preparing a QGIS project to generate polished interactive maps via qgis2web.
I discovered QGIS a few years ago. Over time it has become my go-to desktop GUI for GIS work.
Click here for the interactive map.
QGIS Project
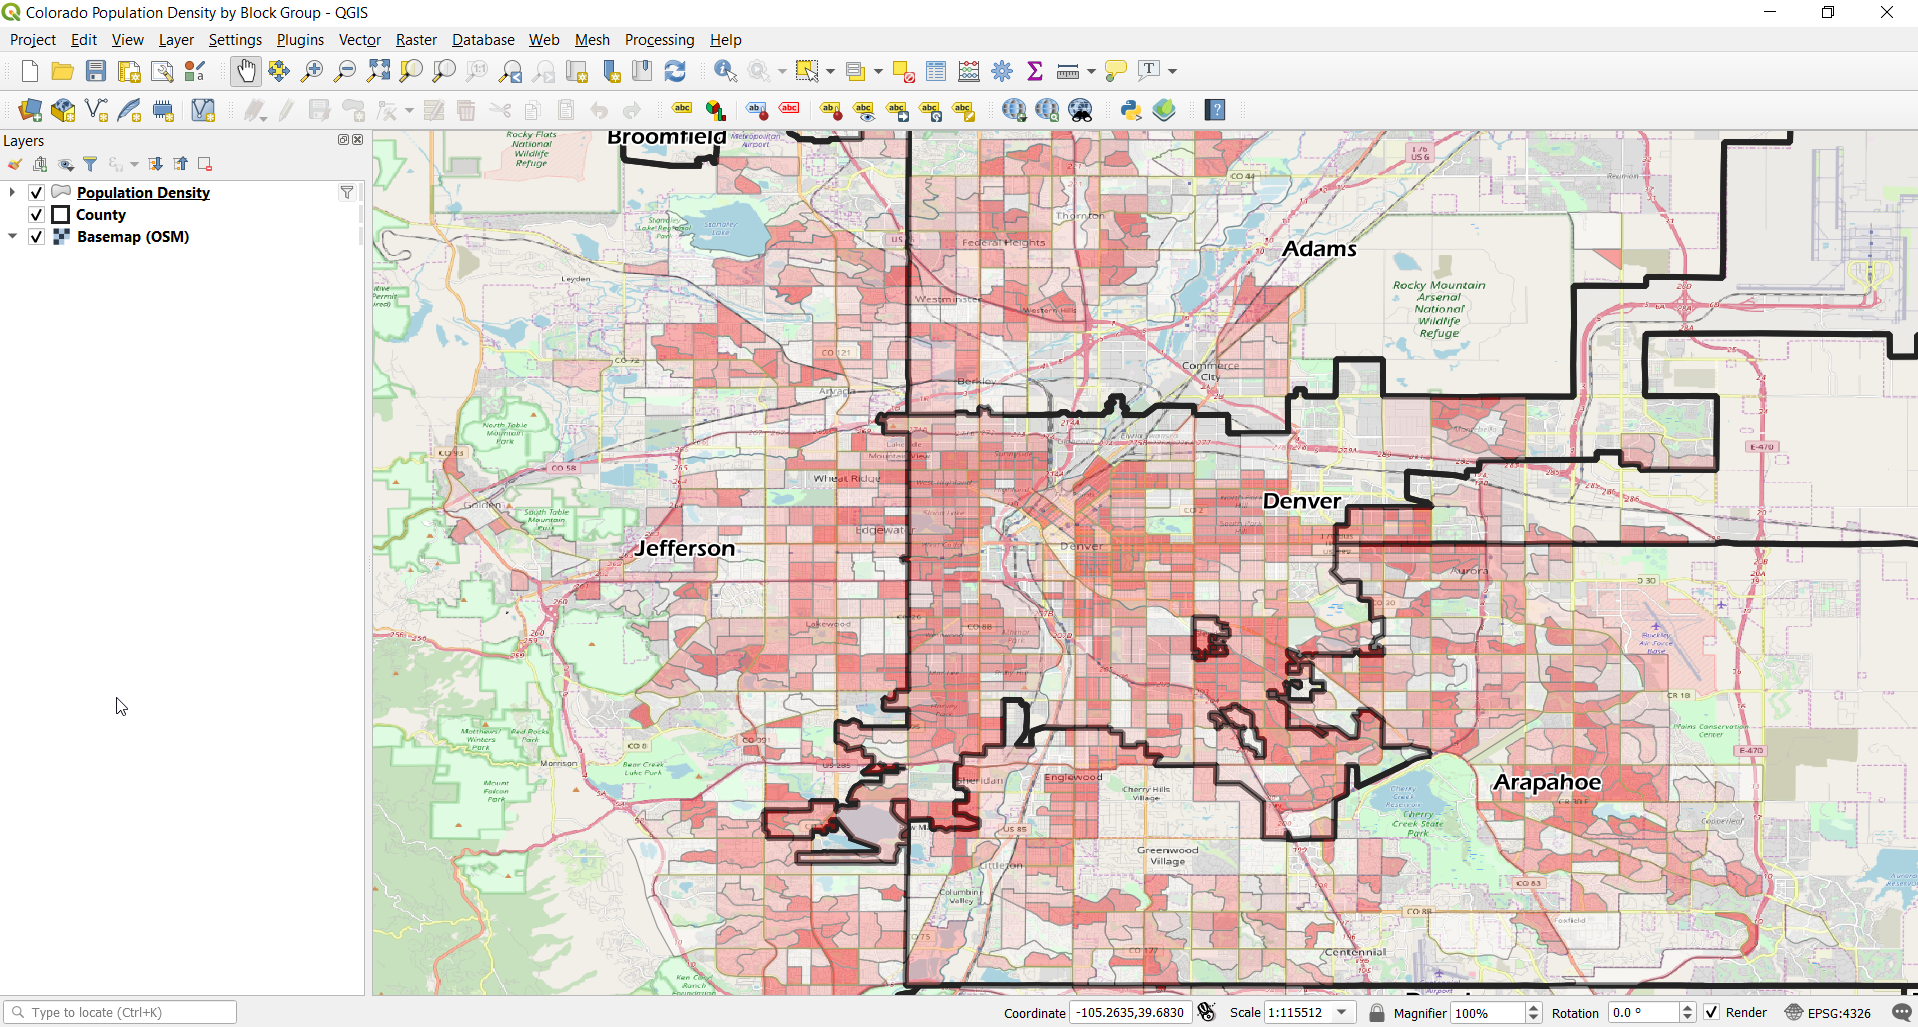
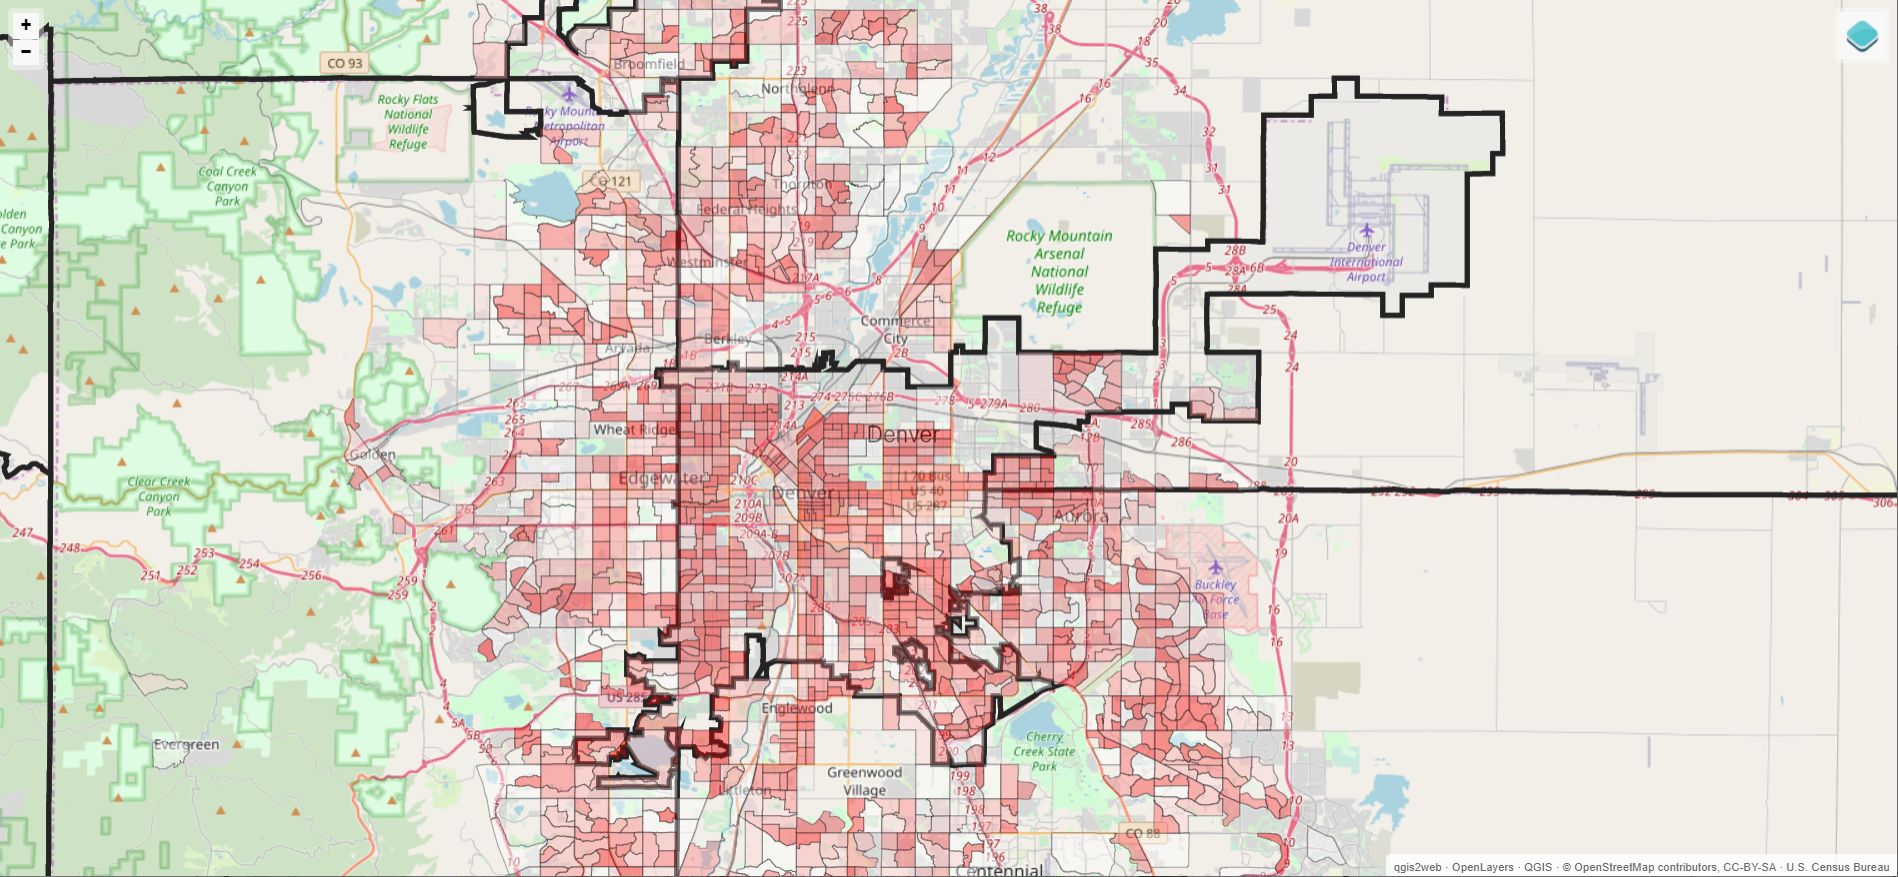
I setup an example project in QGIS that uses an OpenStreetMap base layer (from QuickMapServices plug-in) plus two layers of U.S. Census Bureau data loaded from a PostGIS database I had handy. One layer provides boundaries and labels for the counties in Colorado, the other visualizes population density by block group.
The following screenshot shows the layers and map as seen in QGIS. The red polygons show the population density with darker reds indicating more densely populated areas.
Project Title
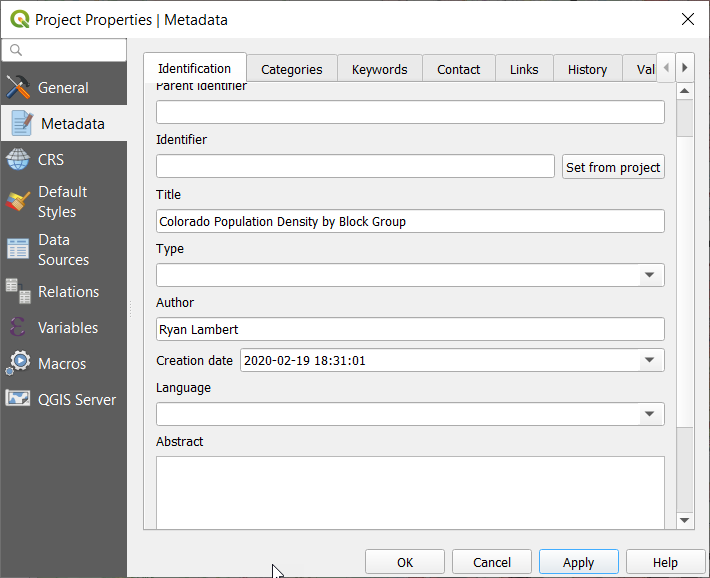
In the QGIS Project Properties (Project > Properties), I set the project title on the meta-data tab. This title will be displayed on the Leaflet version of the map and is the title of the page, displayed on the browser tab.
Layer Attribution
Attribution is important when sharing data. It is always good (often required) to give credit to your data sources. In QGIS we can define attribution in each layer's Layer Properties dialog. The attribution is available under the "QGIS Server" tab (lower left).
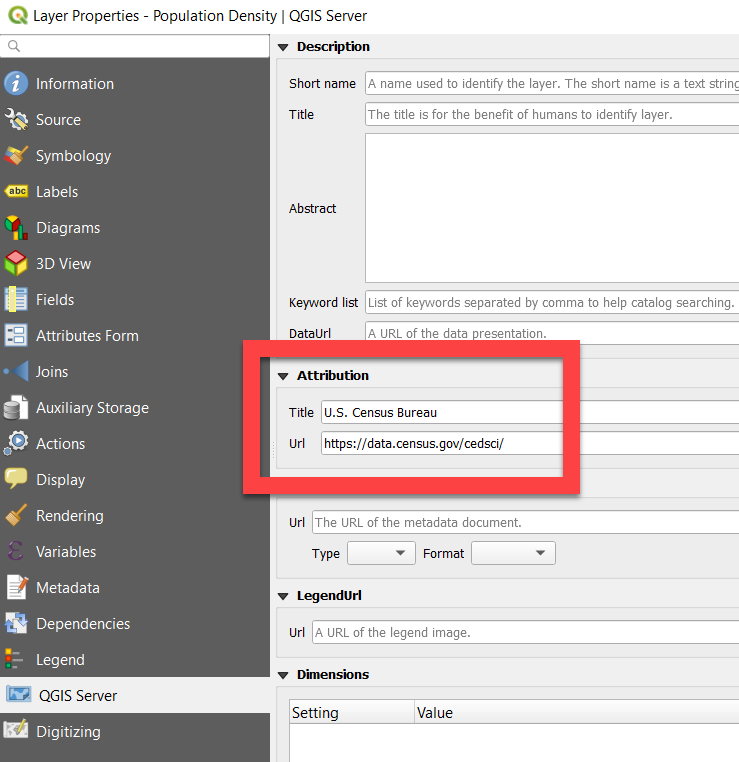
The title value is displayed and the URL hyperlinked as part of attribution bar in the lower-right corner of the qgis2web-generated map. The map output includes the attribution added for the U.S. Census Bureau, as well as the OpenStreetMap Contributors. I did not have to manually add the OSM attribution, the OSM basemap layer used added this information by default.

Using qgis2web
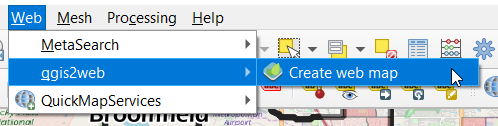
The qgis2web plugin is available through the Web menu. The Create Web Map option opens the dialog with multiple tabs for settings.
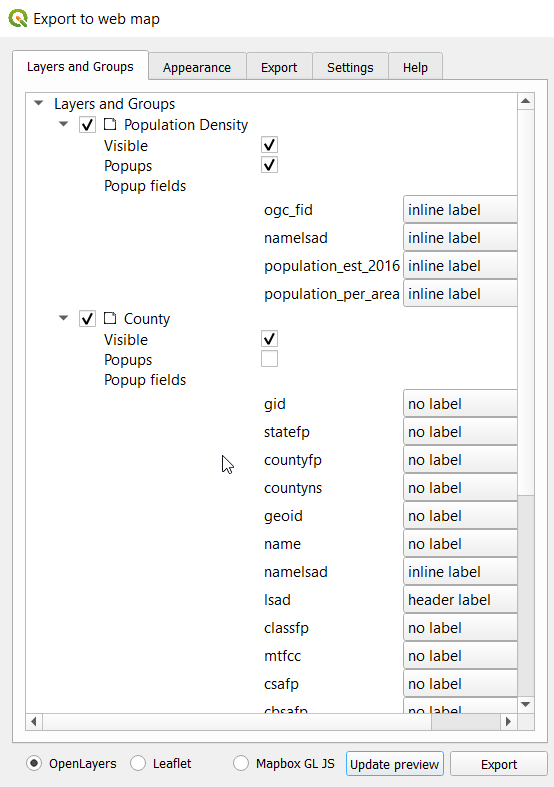
Layers and Groups
Layers and Groups is the first tab and controls default visibility and pop-up behavior. For pop-ups, I like the look of inline labels most of the time. It seems to be good to only enable pop-ups on only one layer, otherwise the displayed output gets cluttered.
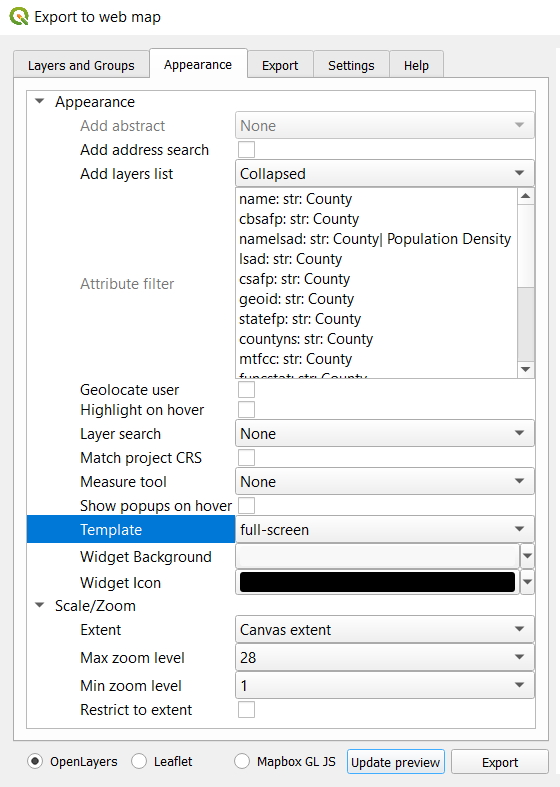
Appearance
In the Appearance tab, set Add Layers List to Collapsed, this allows the user to toggle layers. If this is left to the default of None, the default layer visibility (under Layers and Groups) is the only layer visibility. Lower in the tab I change the Template to full-screen.
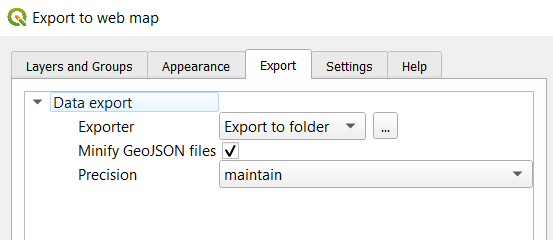
Export
The export tab allows defining the output directory for the generated files. There is a Minify GeoJSON option plus an option to reduce Precision if desired, both intended to reduce the final output size. When reducing precision, you will want to test and experiment with your data to ensure it does not reduce quality too far.
Output examples
Below are examples of the three output formats in my preferred order. Select your desired output at the bottom of the Create web map dialog.
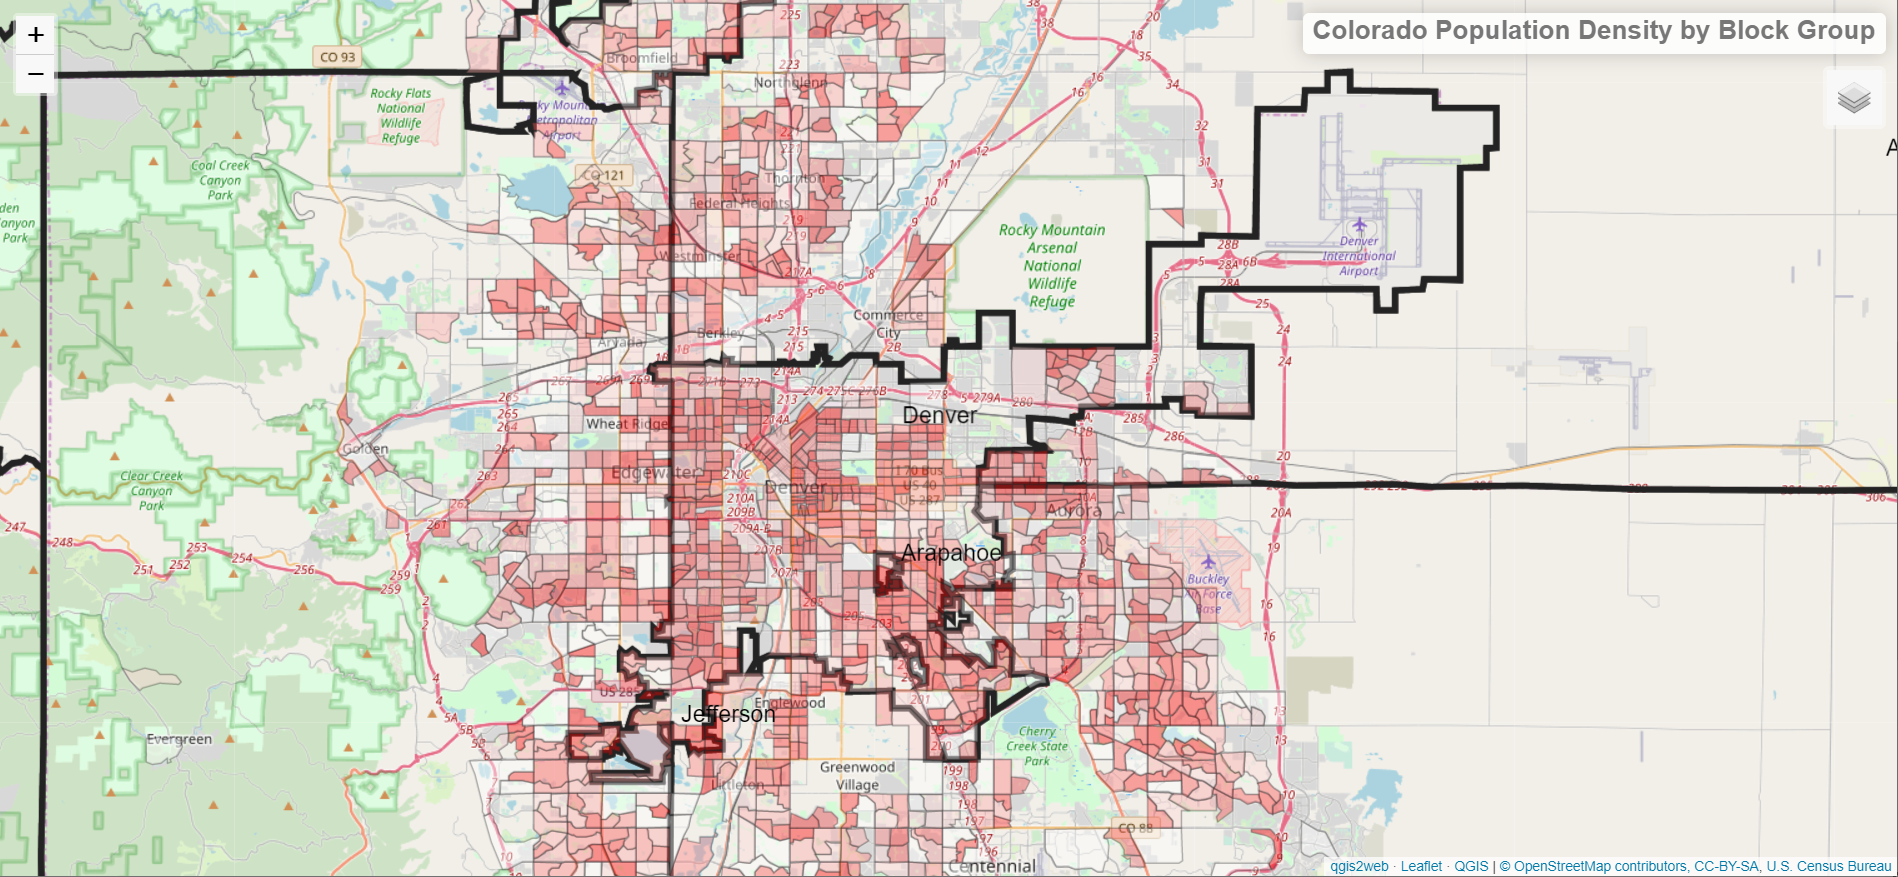
Leaflet output
The Leaflet output ended up being my favorite at this time. The main reasons are because it seems to most-closely tracks the styling in QGIS, displays the project title at the top right, and the attribution font is a readable size.
OpenLayer output
I like the OpenLayer output almost as much as the Leaflet. It seems to run a little faster than Leaflet, but does not display the project's title. For my cases I prefer having the title prominent and visible.
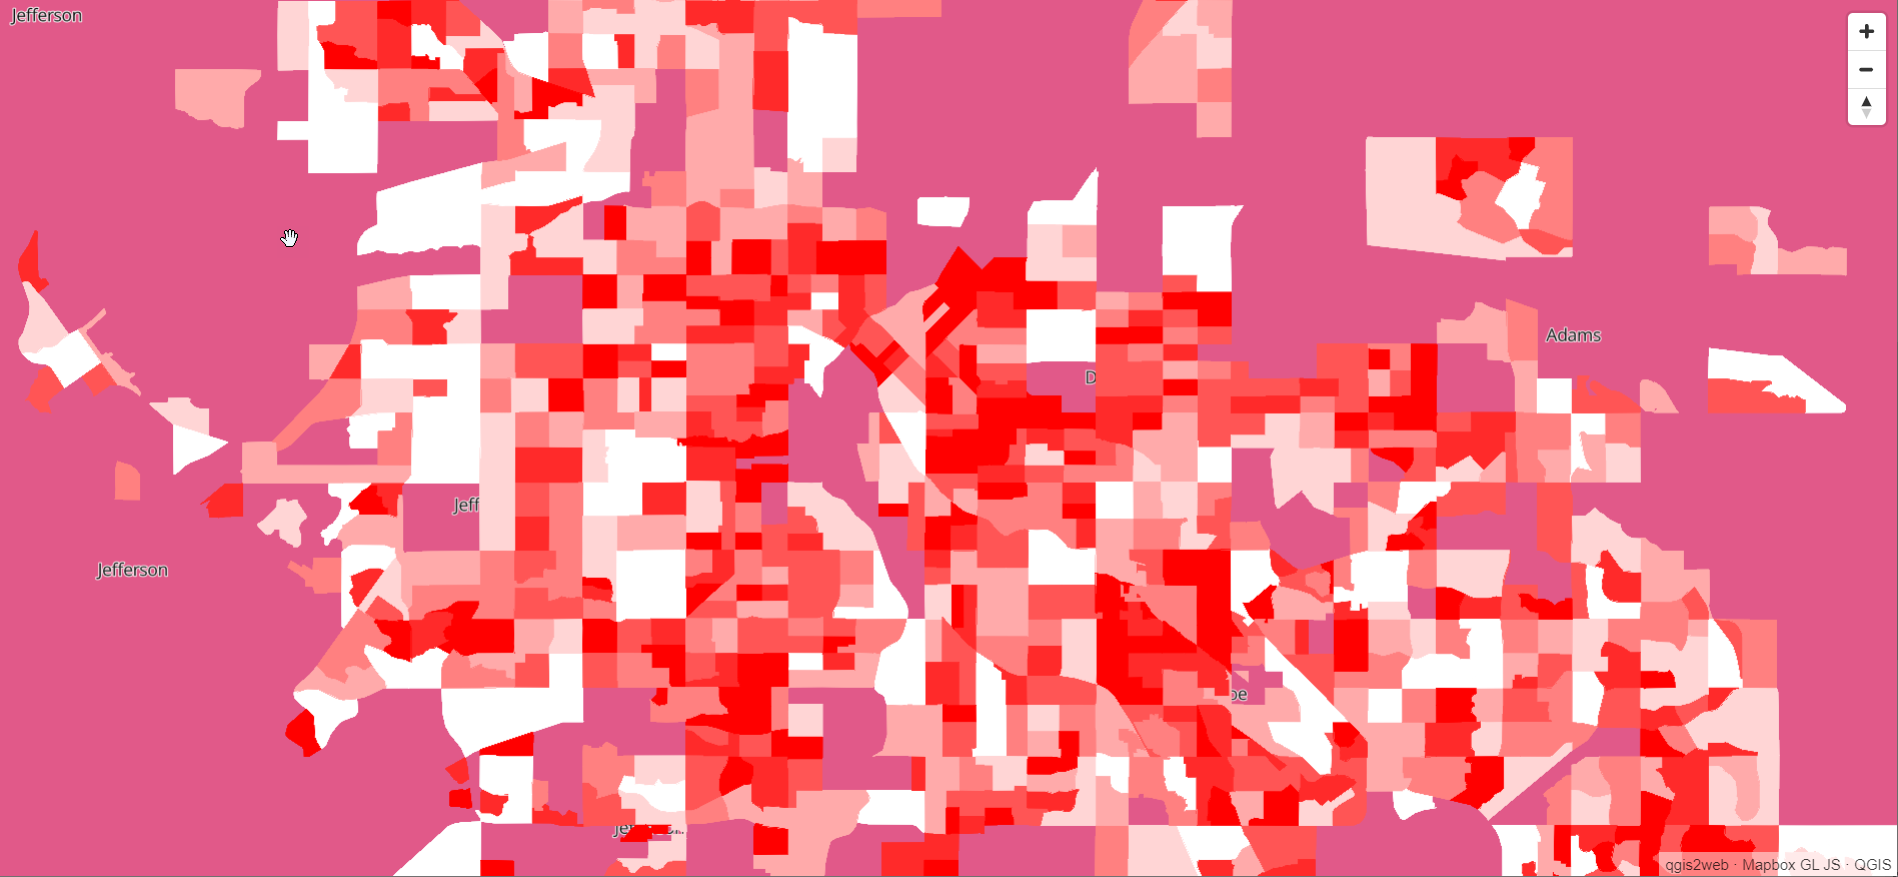
MapBox output
I have used MapBox GL JS for a few web maps and been quite happy with it. However, the generated output from qgis2web has a couple issues. First, the generated output doesn't handle transparency from QGIS properly. It seems the solution is manually hacking the HTML. I could go that route, but with the other two options working with transparency by default I wasn't sold on the manual steps. Also, the attribution details do not include the copyright details like the other two map formats.
Interactive Map
The fully interactive map
Leaflet format, is available here, click to open and explore
in a new tab.
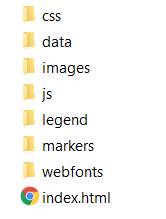
The output from qgis2web is an index.html file and a set of
folders containing GeoJSON, JavaScript and CSS files.
If you have a web server handy, you can host the files that
way. It's easy enough to put them into a .zip and share that way, this allows
essentially a zero-overhead method of distribution.
Summary
This post illustrated the basics of how to export an interactive map from QGIS using qgis2web. The interactive nature of these generated maps can allow end users a great way to explore the data, beyond static outputs such as PDF or PNG format. With a variety of easy distribution methods, this makes it much easier to share the interactivity!
Need help with your PostgreSQL servers or databases? Contact us to start the conversation!
 Mastodon