Performance Testing RustProof Content
In June I made the change to using my own custom-built blog platform: RustProof Content. Before going live I did enough performance testing to at least know that in terms of performance, RustProof Content would blow WordPress away. Now that it's been live for about a month and I had a bit of free time, I decided it was time to start benchmarking RustProof Content's performance a bit more thoroughly.
Setting Up for Testing
When deciding if I should leave WordPress or not, I used New Relic to help identify the issues I was experiencing with performance. Now that the switch has been made, I'm back using New Relic to ensure this site continues to perform as expected. I'm taking advantage of their Application (APM), Browser and Server monitoring tools to keep everything in check.
New Relic's monitoring is simple to setup with top-notch performance. If you're still using Munin for monitoring, you might want to consider switching.
Each VPS and VM I use has the New Relic server monitoring daemon installed, so even my local virtual machines are reporting into my New Relic Dashboard whenever they're powered on. Pretty cool. I've also installed the New Relic Python agent inside the Docker image that runs RustProof Content, so every Docker container I spool up starts with the monitoring enabled by default. This provides the reporting needed for the APM and Browser metrics.
For load testing I use Apache's JMeter to throw thousands of requests at various pages. While JMeter is doing its thing, I fire up a few browsers (Chrome, Firefox and Safari) and poke around the website at the same time. This allows me to record how the servers perform under various loads in New Relic while still getting to feel how the site performs for a real user.
Note: My early tests were using Flask's built-in Tornado WSGI server while later tests use uWSGI. New Relic's Python agent does not support Torando 4.0+.
Defining the Tests
Before testing, you need to decide what to test. I settled on three use-case scenarios to test for:
-
Normal daily load
-
Spike loads of Normal Users
-
Spike loads of Malicious Users
Regular Usage
RustProof Labs has almost 100 users per day with 2-3 page views per user. Don't forget to factor in the 300-500 requests per day from the various bots and spiders along with another 100 requests that can only have malicious intent. With all of those combined I estimated this server was handling 1,000 HTTP requests per day. New Relic's server monitoring tells me it's just over 3,000 requests per day.
Spike Usage
On occasion I present to various groups, and for those I often have examples or slides posted on my website for folks to download to accent my talk. I've spoken in front of groups with almost 150 attendees, so I want to make sure that if 150 people all go to my site at once and poke around, it won't bring the user experience to a grinding halt. That wouldn't be very good...
Malicious Usage
There was one time that an attack was able to take down my site for a couple minutes by throwing a few hundred bad requests at it and starving MySQL out of RAM. The vulnerability was fixable, but it highlighted the need to be able to withstand a script-kiddie with a few drone machines and nothing better to do. This site has seen a few more ambitious attempts throwing up to 100 requests per second for a short period of time.
JMeter Tests
Having the usage patterns defined that the server needs to be able to handle, I could now setup two sets JMeter tests. I decided to pretty much ignore normal usage because the other two scenarios vastly surpass normal usage.
Unfortunately, I don't have space in this post to show how I setup the JMeter tests.
Test 1: Spike Usage, Popular Pages
For the first test I cover the spike usage scenario. I have three groups of
users (thread groups) setup to land on our three most popular posts and then
navigate to the home page before leaving.
I added a random Gaussian time between each request and the end result is the
site serves just over 16 requests per second for as long as I want. I set this
test to run forever and manually stop the test run after roughly 15 minutes to see
how it holds up to a slightly extended load.
Test 2: Malicious Usage
This test attempts to see how a server handles an overwhelming amount of traffic. I set 100 users to attack the server as quickly as possible requesting a total of 20,000 pages. The goal here is to see if the server can be easily overwhelmed.
All JMeter tests are being ran from a single local node which is likely limiting the total number of requests per second.
Test Run 1: Spike Usage
My initial testing was to ensure the that Flask application handles itself well under load. This test was ran before I made the switch to using uWSGI, so New Relic's APM monitoring wasn't available for this test, but I did have the monitoring daemon installed on the server.
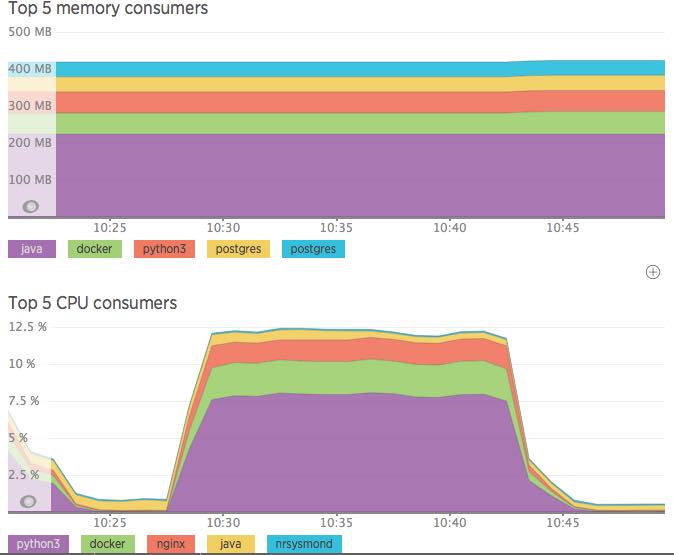
I ran the Popular Pages Spike Usage tests in JMeter. It simulates 119 users requesting 2-3 pages per user, on an infinite loop. In 15 minutes JMeter threw 14,624 total requests at the site with a median response time of 7 ms and an average response time of 11 ms.
The network response times are quite low because this testing was done entirely in my local environment. I wanted to test the application, not the network so I'm OK with that.
In the screen shot below from New Relic's server monitoring, you can see the RAM usage remained constant but the CPU noticed the increase in load! Under no load, the server rests nicely with CPU hanging under 1% utilization and spikes up to about 12% under a load of just over 16 requests per second.

Note: My development server has Jenkins CI installed which is why you see > 200MB RAM consumed by Java.
Test Run 2: Malicious Usage
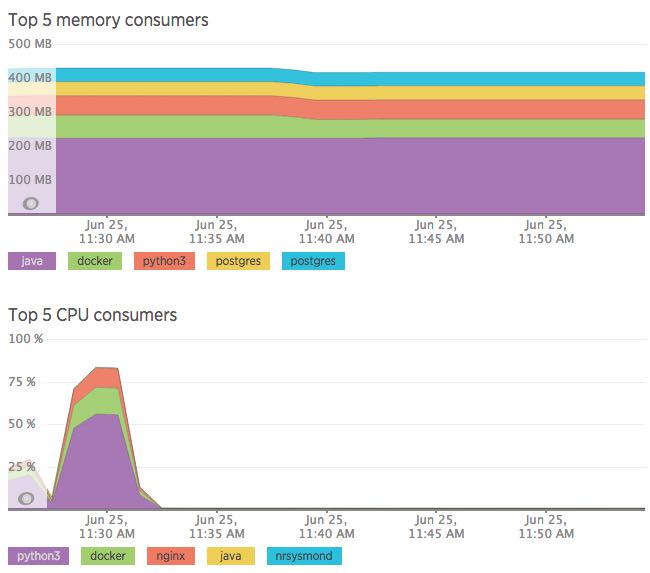
Next I ran the malicious test against the same virtual which resulted in the server processing more than 130 requests per second. This put 20,000 requests to the server in right around 2 minutes. The CPU got hit a lot harder than in the first test, but that was to be expected.

I performed another three rounds of testing but didn't find anything else worth writing about here.
Google Fonts and the "Great (Fire)Wall"
While the initial testing was interesting, I didn't expect to find the next issue I discovered. I started examining response times a little closer and noticed that requests from China were terribly slow. Most requests from China were clocking in at over 10 seconds which is completely unacceptable.
If anyone has comments about the user experience from outside the US, please get in touch and let us know how we're doing!
In case you haven't heard, China isn't big on allowing it's citizens to see just anything. While I knew about China's firewall before, and I certainly knew that Google and China aren't best-buds... I didn't connect the dots until I saw it in my metrics... China blocked Google's CDN that serves the Google Fonts service in 2014.
So, when anyone from within China tried to access my site they were forced to wait until the call to Google's CDN failed before their browser would load the rest of the content. Bummer, and not acceptable! I want my site to be as fast as possible for as many of my visitors as possible, regardless of where they're visiting from.
This left me with three possible fixes:
-
Download and serve the Fonts locally from RustProof Labs' servers
-
Add JavaScript to load the Google Fonts AFTER the rest of the content loaded
-
Not use Google Fonts
Option: Serve Fonts Locally
At first I planned on serving the fonts locally, but with all the various formats and the fact that I know literally nothing about font technology I decided that might not be the best choice. I have little interest in learning more about fonts, so I can't justify the time (and life!) it would inevitably suck out of me.
Option: Delay Font Loading
The second option that many people suggest is to use some flavor of JavaScript to load the Google Font after the main content loads. The problem is, I really don't like writing JS. I do write JavaScript when it's necessary, but a font from Google is not a necessity.
Option: No Google Fonts
The decision I made was to use simple, default fonts for now. In my opinion, they look fine and they're not a deal-breaker on my site. The font is legible, and most importantly it doesn't destroy performance just because of where someone lives.
If you hate the default sans-serif font... blame the
Great Firewall
for blocking Google's CDN, but I'm not wasting any more time on a font.
Image Formats
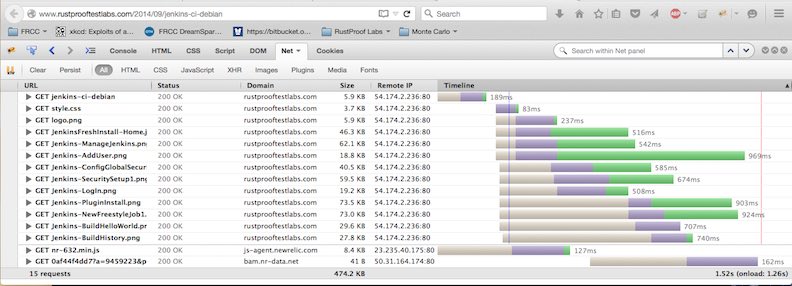
The last improvement I've started to implement is reducing the footprint of some of the "heavier" pages on the site, like this one with 10 screenshots. I've done an OK job up through now keeping the file sizes from being too bloated, but I can do better. The original version used PNG format and the page weighed in at almost 500 KB.

By converting the PNG images to JPEG I was able to shave off over 100 KB to reduce the total page size by 22%! While this might not seem like a lot on a desktop with a fast connection, it feels like a lot if you're working with a weak cell signal on a phone.

Summary
Performance is crucial in today's world and was one of the major reasons I built my own blog platform. I started this blog two years ago (Woah, already?!) with the purpose of giving back to the wider community, but that can't happen if this site loads too slow. The only way I can effectively share what I've written is if my site's visitors can get to what they want before they lose interest.
I think I've made great strides at getting RustProof Content's performance where I think it should be. Hopefully it feels the same way to you!
