
Load the Right Amount of OpenStreetMap Data
Populating a PostGIS database with OpenStreetMap data is favorite way to start a new geospatial project. Loading a region of OpenStreetMap data enables you with data ranging from roads, buildings, water features, amenities, and so much more! The breadth and bulk of data is great, but it can turn into a hinderance especially for projects focused on smaller regions. This post explores how to use PgOSM Flex with custom layersets, multiple schemas, and osmium. The goal is load limited data for a larger region, while loading detailed data for a smaller, target region.
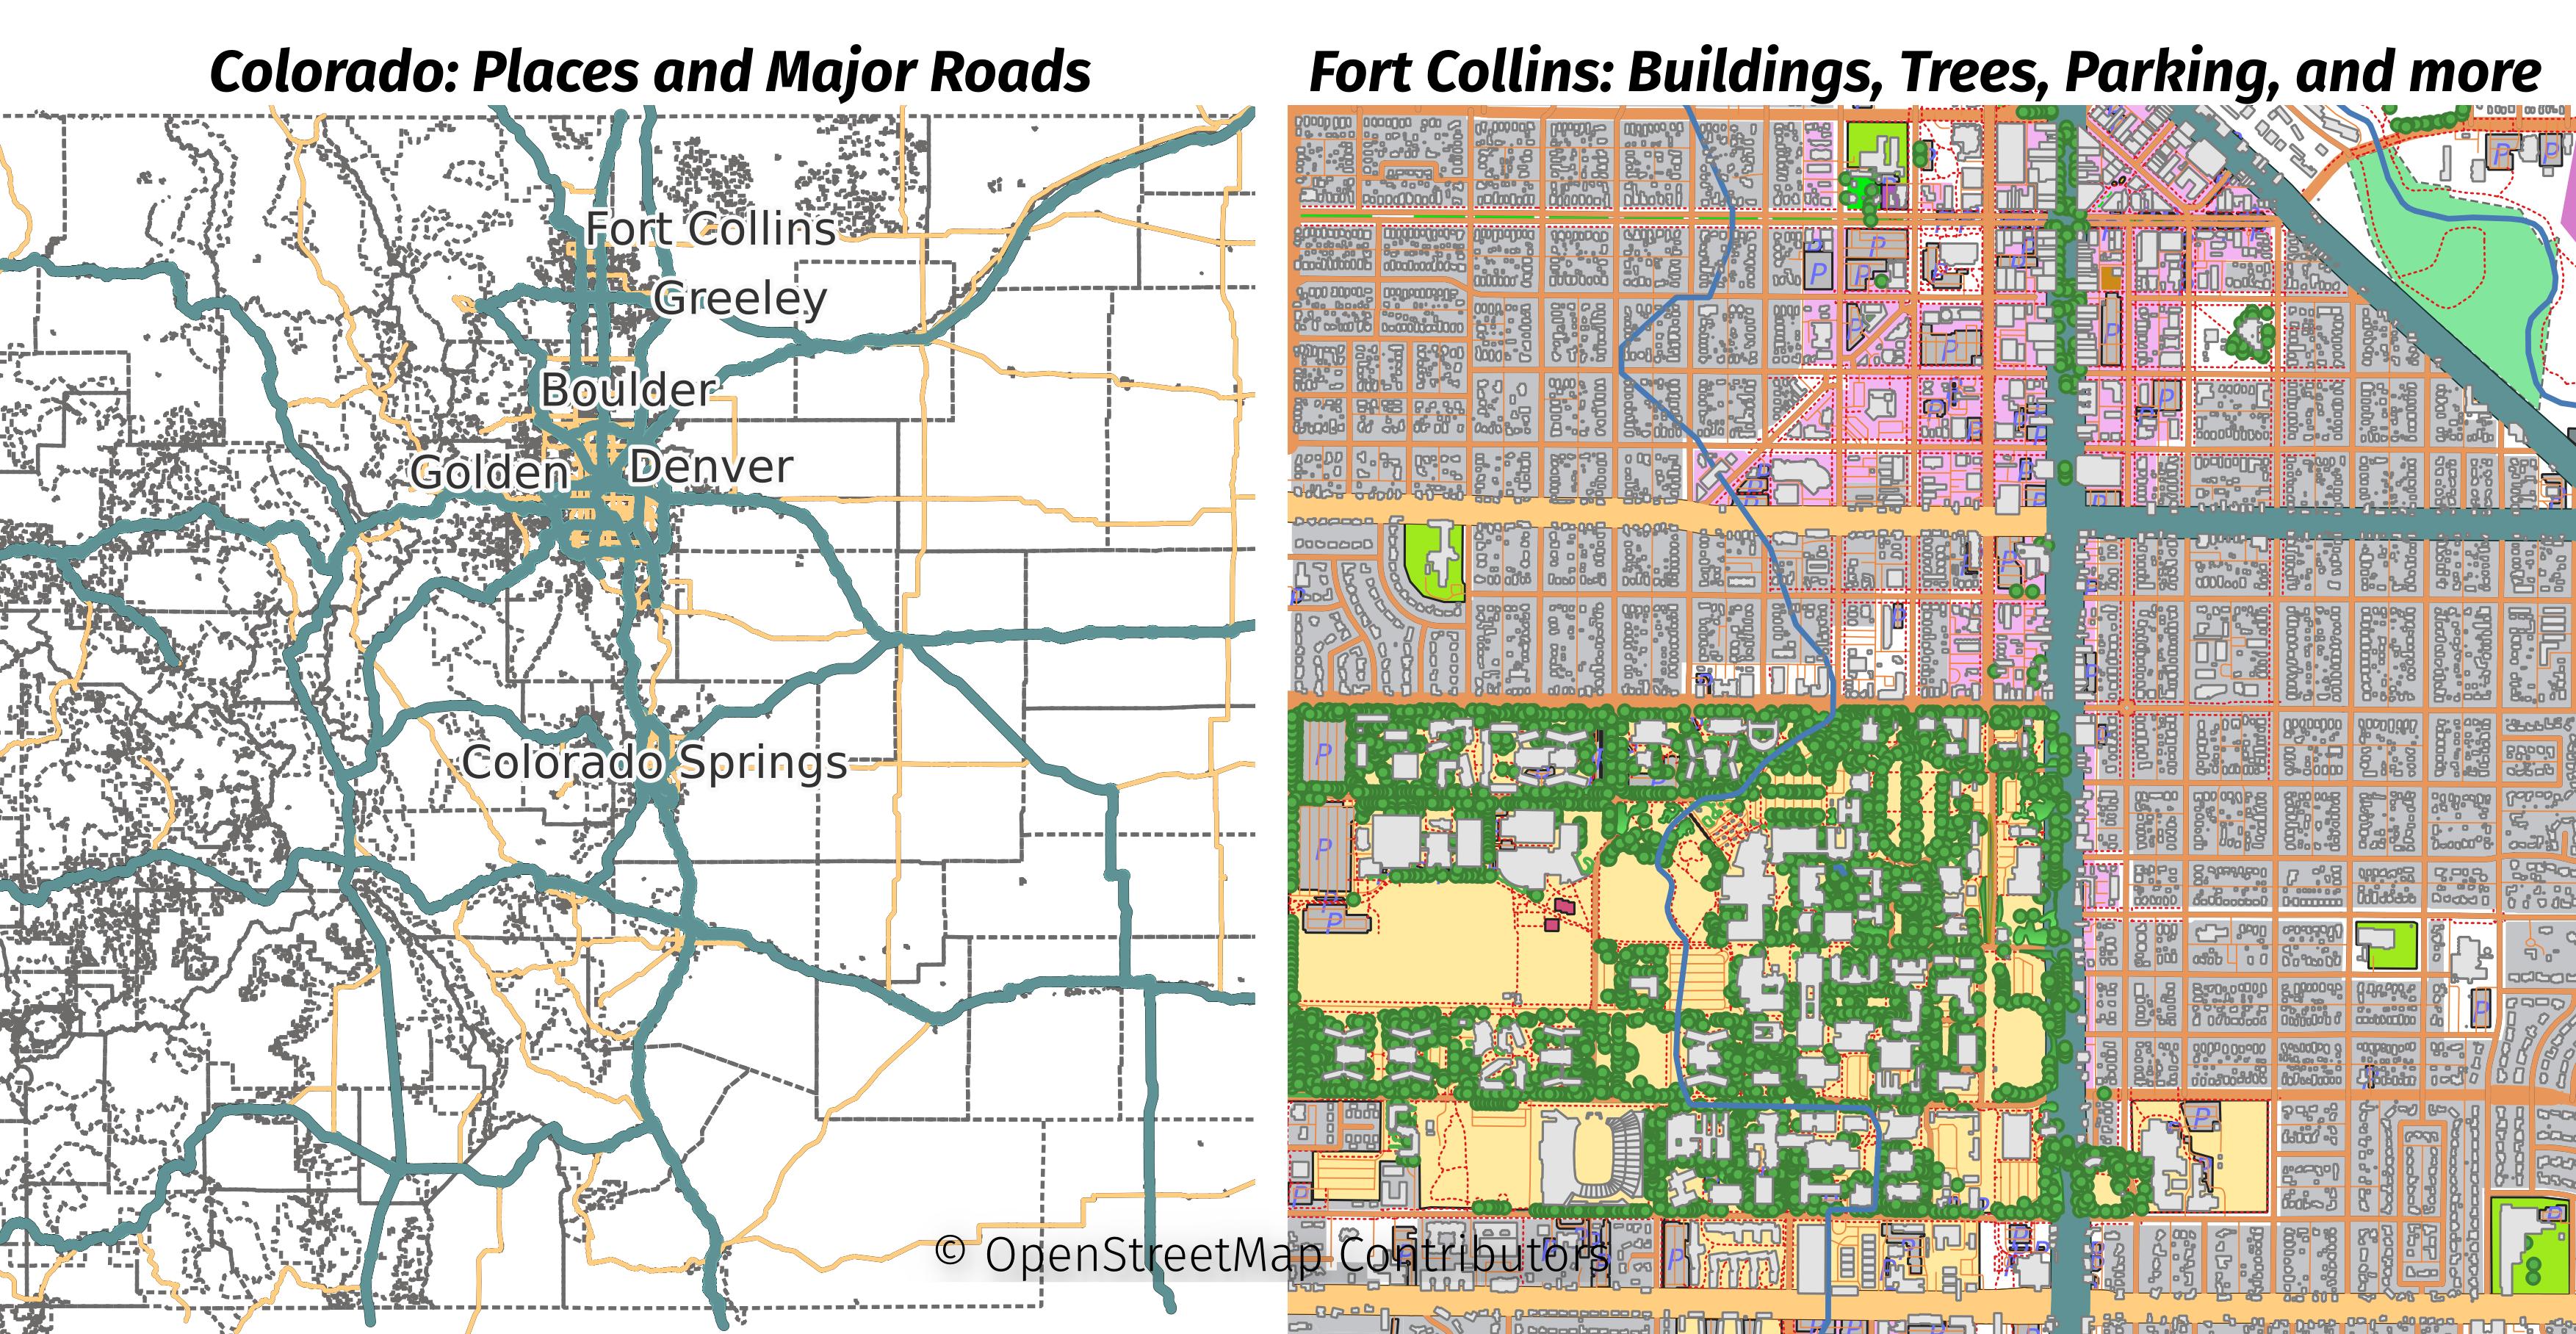
The larger region for this post will be the Colorado extract from Geofabrik. The smaller region will be the Fort Collins area, extracted from the Colorado file. The following image shows the data loaded in this post with two maps side-by-side. The minimal data loaded for all of Colorado is shown on the left and the full details of Fort Collins is on the right.
Setup Custom Layersets
The first thing to do is setup custom layersets
for PgOSM Flex. I create the ~/custom-layerset directory to put the ini files
into. The first layerset is defined in ~/custom-layerset/large-region.ini
with the following contents. This enables the place layer and road_major
layers.
[layerset]
place=true
road_major=true
The second layerset is defined in ~/custom-layerset/local-region.ini. I started
this layerset with the
everything.ini included with
PgOSM Flex and removed some layers not needed for the project at hand.
[layerset]
amenity=true
building=true
indoor=true
infrastructure=true
landuse=true
leisure=true
natural=true
place=true
public_transport=true
road=true
shop=true
shop_combined_point=true
tags=true
traffic=true
water=true
Run PgOSM Flex
This post uses PgOSM Flex version 0.10.1 to load data to Postgres 15 running locally. The instructions in the external Postgres connection explain how to use the Docker container to load data into a Postgres instance of your choice, bypassing the built-in database.
The docker run command needs environment variables set, I do so with
this source command.
source ~/.pgosm-db-pgosm-dev
Run the PgOSM Flex docker image using the environment variables from the
above command. This docker run command combines details from the
External Postgres
and
Custom Layerset
sections of the documentation.
docker run --name pgosm -d --rm \
    -v ~/pgosm-data:/app/output \
    -v /etc/localtime:/etc/localtime:ro \
    -e POSTGRES_USER=$POSTGRES_USER \
    -e POSTGRES_PASSWORD=$POSTGRES_PASSWORD \
    -e POSTGRES_HOST=$POSTGRES_HOST \
    -e POSTGRES_DB=$POSTGRES_DB \
    -e POSTGRES_PORT=$POSTGRES_PORT \
    -v ~/custom-layerset:/custom-layerset \
    -p 5433:5432 -d rustprooflabs/pgosm-flex
It's always worth checking the Docker container is running with docker ps -a.
CONTAINER ID   IMAGE                      COMMAND                  CREATED         STATUS         PORTS                                       NAMES
e7f80926a823   rustprooflabs/pgosm-flex   "docker-entrypoint.s…"   5 seconds ago   Up 4 seconds   0.0.0.0:5433->5432/tcp, :::5433->5432/tcp   pgosm
I'm presenting a full day pre-conference session titled PostGIS and PostgreSQL: GIS Data, Queries, and Performance at PASS 2023 in November! I hope to see you there!
Load larger region
The following docker exec command loads the Colorado region using the
minimized layerset large-region defined above. The command uses
the the new --schema-name option
added in v0.10.1 to save the data into osm_co, instead of the default osm.
time docker exec -it \
    pgosm python3 docker/pgosm_flex.py \
    --ram=8 \
    --region=north-america/us \
    --subregion=colorado \
    --schema-name=osm_co \
    --layerset=large-region \
    --layerset-path=/custom-layerset/
The above completes on my laptop in 41 seconds to create the 6 tables.
The resulting data in the osm_co schema is only 50 MB.
Compare this to Colorado with the default layerset
weighing in with more than 2 GB and taking closer to 10 minutes.
SELECT s_name, table_count, size_plus_indexes
    FROM dd.schemas
    WHERE s_name LIKE 'osm%'
;

┌────────┬─────────────┬───────────────────┐
│ s_name │ table_count │ size_plus_indexes │
╞════════╪═════════════╪═══════════════════╡
│ osm_co │           6 │ 50 MB             │
└────────┴─────────────┴───────────────────┘
Load local region
The next step is to extract Fort Collins area data from the larger Colorado region.
The osmium tool
with the --bbox option makes this easy enough.
cd ~/pgosm-data
osmium extract --bbox=-105.19,40.47,-104.98,40.64 \
    -o co-ft-collins.osm.pbf \
    colorado-2023-08-24.osm.pbf
I used Geofabrik's tile calculator tool to get the bounding box used above.
Run PgOSM Flex again using --schema-name=osm_foco
and add the --input-file option
to define the file created from osmium. Using the local-region layerset
this will load far more data items for Fort Collins compared to what was loaded
for the larger Colorado region.
time docker exec -it \
    pgosm python3 docker/pgosm_flex.py \
    --ram=8 \
    --region=north-america/us \
    --subregion=colorado/ft-collins \
    --input-file=co-ft-collins.osm.pbf \
    --pgosm-date=2023-08-24 \
    --schema-name=osm_foco \
    --layerset=local-region \
    --layerset-path=/custom-layerset/
The above command runs in about 30 seconds. Re-running the query against
dd.schemas shows that the osm_foco schema has 39 tables and takes almost
70MB on disk.
┌──────────┬─────────────┬───────────────────┐
│  s_name  │ table_count │ size_plus_indexes │
╞══════════╪═════════════╪═══════════════════╡
│ osm_co   │           6 │ 50 MB             │
│ osm_foco │          39 │ 69 MB             │
└──────────┴─────────────┴───────────────────┘
Let's revisit the image from the beginning of this post. A wide range of OpenStreetMap data is available for the Fort Collins region, while the wider Colorado region has only major roads and place details. This sets up a project for detailed spatial analysis and visualization for the Fort Collins area, while allowing extending visualizations beyond the borders of the detailed data when desired.
Summary
The technique of loading different detail levels for different regions has a wide range of practical uses. Being able to load multiple, targeted subregions with detailed data lets the casual spatial analyst explore without the longer wait times or increased hardware requirements of loading entire larger regions.
Need help with your PostgreSQL servers or databases? Contact us to start the conversation!
 Mastodon