Track performance differences with pg_stat_statements
This is my entry for PgSQL Phriday #008. It's Saturday, so I guess this is a day
late!
This
month's topic,
chosen by Michael from pgMustard,
is on the excellent pg_stat_statements extension.
When I saw Michael was the host this month I knew he'd pick a topic I would want
to contribute on!
Michael's post for his own topic
provides helpful queries and good reminders about changes to columns
between Postgres version 12 and 13.
In this post I show one way I like using pg_stat_statements: tracking the
impact of configuration changes to a specific workload. I used a contrived change
to configuration to quickly make an obvious impact.
Process to test
I am using PgOSM Flex to load Colorado OpenStreetMap data to PostGIS. PgOSM Flex uses a multi-step ETL that prepares the database, runs osm2pgsql, and then runs multiple post-processing steps. This results in 2.4 GB of data into Postgres. That should be enough activity to show something interesting.
Configuration changes
Processes like PgOSM Flex are sensitive to a few configuration options in
postgresql.conf.
The first configuration change I though of was maintenance_work_mem. While
I was in there I decided to drop shared_buffers and work_mem to much lower
values too. Just to be sure my tests showed a difference!
My local Postgres 15 instance has these settings for my daily use. This is Configuration A for this post.
shared_buffers = 4GB
work_mem = 10MB
maintenance_work_mem = 1GB
My comparison, Configuration B, dropped each of those settings to unbearably low
values. I imagine setting maintenance_work_mem = 1MB was sufficient for
showing a difference.
shared_buffers = 4MB
work_mem = 1MB
maintenance_work_mem = 1MB
Clean database
Before running each test I setup a clean database with the prerequisites and
reset pg_stat_statements for a clean slate.
SELECT pg_stat_statements_reset();
At this point I run the process and wait. While I'm testing PgOSM Flex, you can test whatever you like as long as you have a scripted, reproducible processes in a controlled environment.
The following query is ran after the test run completes. This calcualtes
a query_type column with some typical groupings. Some of the query_type
values are project specific (e.g. WHEN query ILIKE '%CALL osm%' THEN 'PgOSM Flex processing').
I put this into a temp table so I can further query and manipulate it.
This type of querying is often fairly ad-hoc, specific to the database in question.
DROP TABLE IF EXISTS queries;
CREATE TABLE queries AS
SELECT CASE WHEN query ILIKE '%COMMENT ON%'
                    OR query ILIKE 'BEGIN'
                    OR query ILIKE 'SET%'
                    OR query ILIKE '%COMMIT%'
                    OR query ILIKE '%ROLLBACK%'
                    OR query ILIKE '%SHOW%'
                    OR query ILIKE '%LOCK%TABLE%'
                THEN 'Controls/Docs'
            WHEN query ILIKE '%UPDATE%'
                OR query ILIKE '%DELETE%'
                THEN 'Update / Delete'
            WHEN query ILIKE '%COPY%'
                OR query ILIKE '%INSERT%'
                THEN 'Data Load'
            WHEN query ILIKE '%CREATE%MAT%VIEW%'
                THEN 'Create MV'
            WHEN query ILIKE '%CREATE%TABLE%'
                    OR query ILIKE '%CREATE%FUNCTION%'
                    OR query ILIKE '%CREATE%SCHEMA%'
                    OR query ILIKE '%ALTER%TABLE%'
                    OR query ILIKE '%CREATE%VIEW%'
                    OR query ILIKE '%CREATE%EXTENSION%'
                THEN 'DDL'
            WHEN query ILIKE '%DROP%TABLE%'
                    OR query ILIKE '%DROP%TRIGGER%'
                    OR query ILIKE '%DROP%FUNCTION%'
                    OR query ILIKE '%DROP%PROCEDURE%'
                THEN 'Drop objects'
            WHEN query ILIKE '%CALL osm%'
                THEN 'PgOSM Flex processing'
            WHEN query ILIKE '%CREATE%INDEX%'
                THEN 'Create Index'
            WHEN query ILIKE 'ANALYZE%'
                THEN 'Analyze (Stats)'
            WHEN query ILIKE '%SELECT%'
                THEN 'SELECT'
            ELSE 'Unknown'
            END AS query_type,
        *
    FROM pg_stat_statements
    ORDER BY mean_exec_time DESC
;
From this temp table I aggregate the data into a non-temp table so I can later
compare results. For this example
I create a stats schema to store the aggregated results.
CREATE SCHEMA stats;
The following query aggregates a few common values by query_type.
The filter on toplevel is optional, I often include it to reduce noise.
Other times I leave it out so I can see a more detailed picture of what's happening.
CREATE TABLE stats.agg_config_a AS
SELECT query_type, COUNT(*), COUNT(DISTINCT queryid) AS distinct_query_count,
        COUNT(*) FILTER (WHERE plans > 0) AS queries_with_plans,
        SUM(plans) AS total_plans,
        SUM(calls) AS total_calls,
        SUM(total_exec_time) AS total_exec_time,
        MAX(max_exec_time) AS max_exec_time,
        SUM(rows) AS total_rows,
        SUM(shared_blks_dirtied) AS shared_blks_dirtied,
        SUM(temp_blks_written) AS temp_blks_written,
        SUM(temp_blk_read_time) AS temp_blk_read_time,
        SUM(temp_blk_write_time) AS temp_blk_write_time,
        SUM(wal_records) AS wal_records,
        pg_size_pretty(SUM(wal_bytes)) AS wal_size
    FROM queries
    WHERE toplevel
    GROUP BY query_type
    ORDER BY total_exec_time DESC
;
After both tests are saved
I ran each test saving the results from pg_stat_statements into
stats.agg_config_a and stats.agg_config_b.
The following query compares the results of the two tests.
SELECT a.query_type, a.total_calls,
        a.total_exec_time::BIGINT AS total_time_a,
        b.total_exec_time::BIGINT AS total_time_b,
        (b.total_exec_time - a.total_exec_time)::BIGINT AS time_diff_ms,
        (b.total_exec_time - a.total_exec_time) / a.total_exec_time
            AS percent_diff
    FROM stats.agg_config_a a
    FULL JOIN stats.agg_config_b b
        ON a.query_type = b.query_type
    ORDER BY time_diff_ms DESC
;

┌───────────────────────┬─────────────┬──────────────┬──────────────┬──────────────┬──────────────────────┐
│      query_type       │ total_calls │ total_time_a │ total_time_b │ time_diff_ms │     percent_diff     │
╞═══════════════════════╪═════════════╪══════════════╪══════════════╪══════════════╪══════════════════════╡
│ Data Load             │         245 │       358854 │       393957 │        35103 │  0.09782046502939316 │
│ Create Index          │         119 │        11929 │        17155 │         5225 │  0.43799236073983533 │
│ DDL                   │         202 │         7745 │        12279 │         4534 │   0.5854177939107483 │
│ Analyze (Stats)       │          39 │         3373 │         4878 │         1505 │   0.4462918308554119 │
│ Create MV             │           3 │         1586 │         1740 │          154 │  0.09696164745742934 │
│ PgOSM Flex processing │           2 │         1413 │         1512 │           99 │  0.07015269212804308 │
│ Update / Delete       │          39 │           46 │           68 │           22 │  0.48861133692158826 │
│ Drop objects          │         166 │          118 │          135 │           17 │   0.1403158906113987 │
│ SELECT                │          30 │           65 │           76 │           11 │  0.17006003902495692 │
│ Controls/Docs         │         634 │           38 │           34 │           -5 │ -0.12137879643848994 │
└───────────────────────┴─────────────┴──────────────┴──────────────┴──────────────┴──────────────────────┘
Visuals
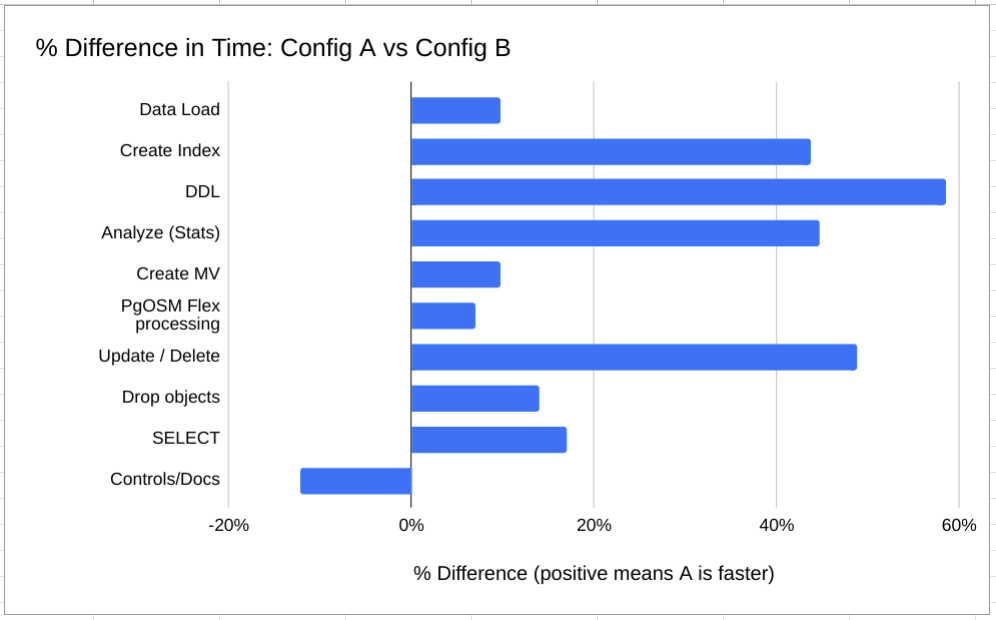
These results can be put into charts easily enough. The first
chart shows % difference between timings of query_type.
This view of the data does not consider the impact on the total time, only
showing the impact by type of operation.

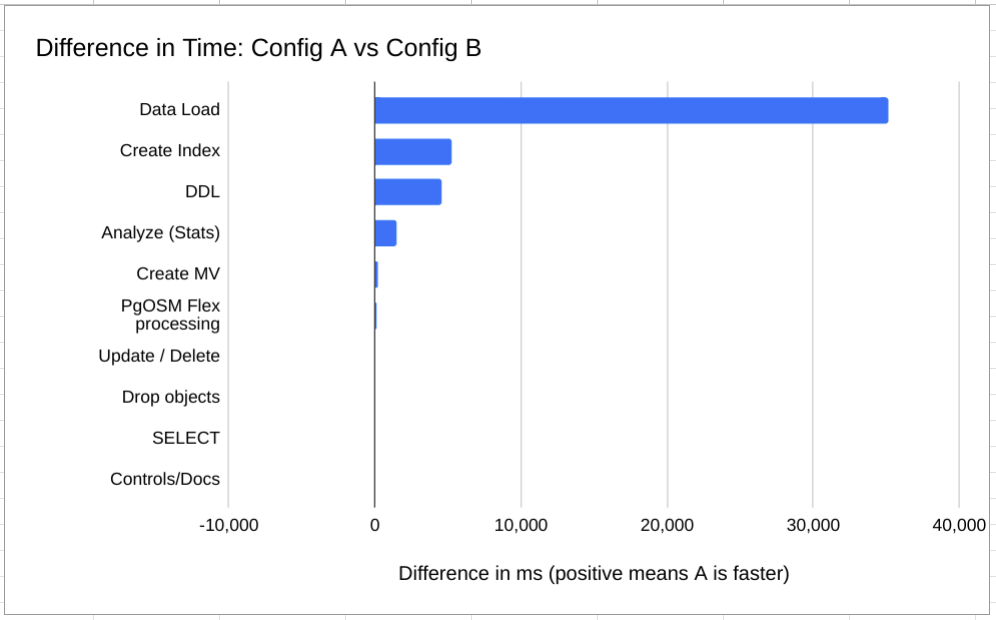
The next chart visualizes the total differences in time by query_type.
While the above chart shows that
data loading (COPY/INSERT) was 10% faster with Configuration A,
the following chart shows that 10% difference amounted 35 seconds.
On the other hand, the UPDATE/DELETE shows a 50% difference when the
total impact was 22 milliseconds.

Summary
This post showed one way I use pg_stat_statements to track performance
in PostgreSQL databases.
This basic approach can be used and adjusted for a wide variety of scenarios.
Thanks again Michael for hosting this month and the great topic!
My #pgsqlphriday category is getting quite the collection going!
Need help with your PostgreSQL servers or databases? Contact us to start the conversation!
