Small Community, Big Changes -- The Impact of a Mapping Party
RustProof Labs just completed another Maptastic mapping party! The event was held on April 9, 2016 in Golden, Colorado. Our home base for the event was with the fantastic folks at Pangea Coffee Roasters. Matt, Amanda, and the rest of their friendly staff couldn't have been better hosts for this event! We had 14 total volunteers with 5 of them being "mini-mappers" under the age of 15. My favorite part of the event was seeing the sheer excitement, thrill and enthusiasm of our mini-mappers (and adults) who participated.
Our Volunteers and Pangea Coffee Roasters all deserve a huge Thank You! Without you, events like this are not possible.
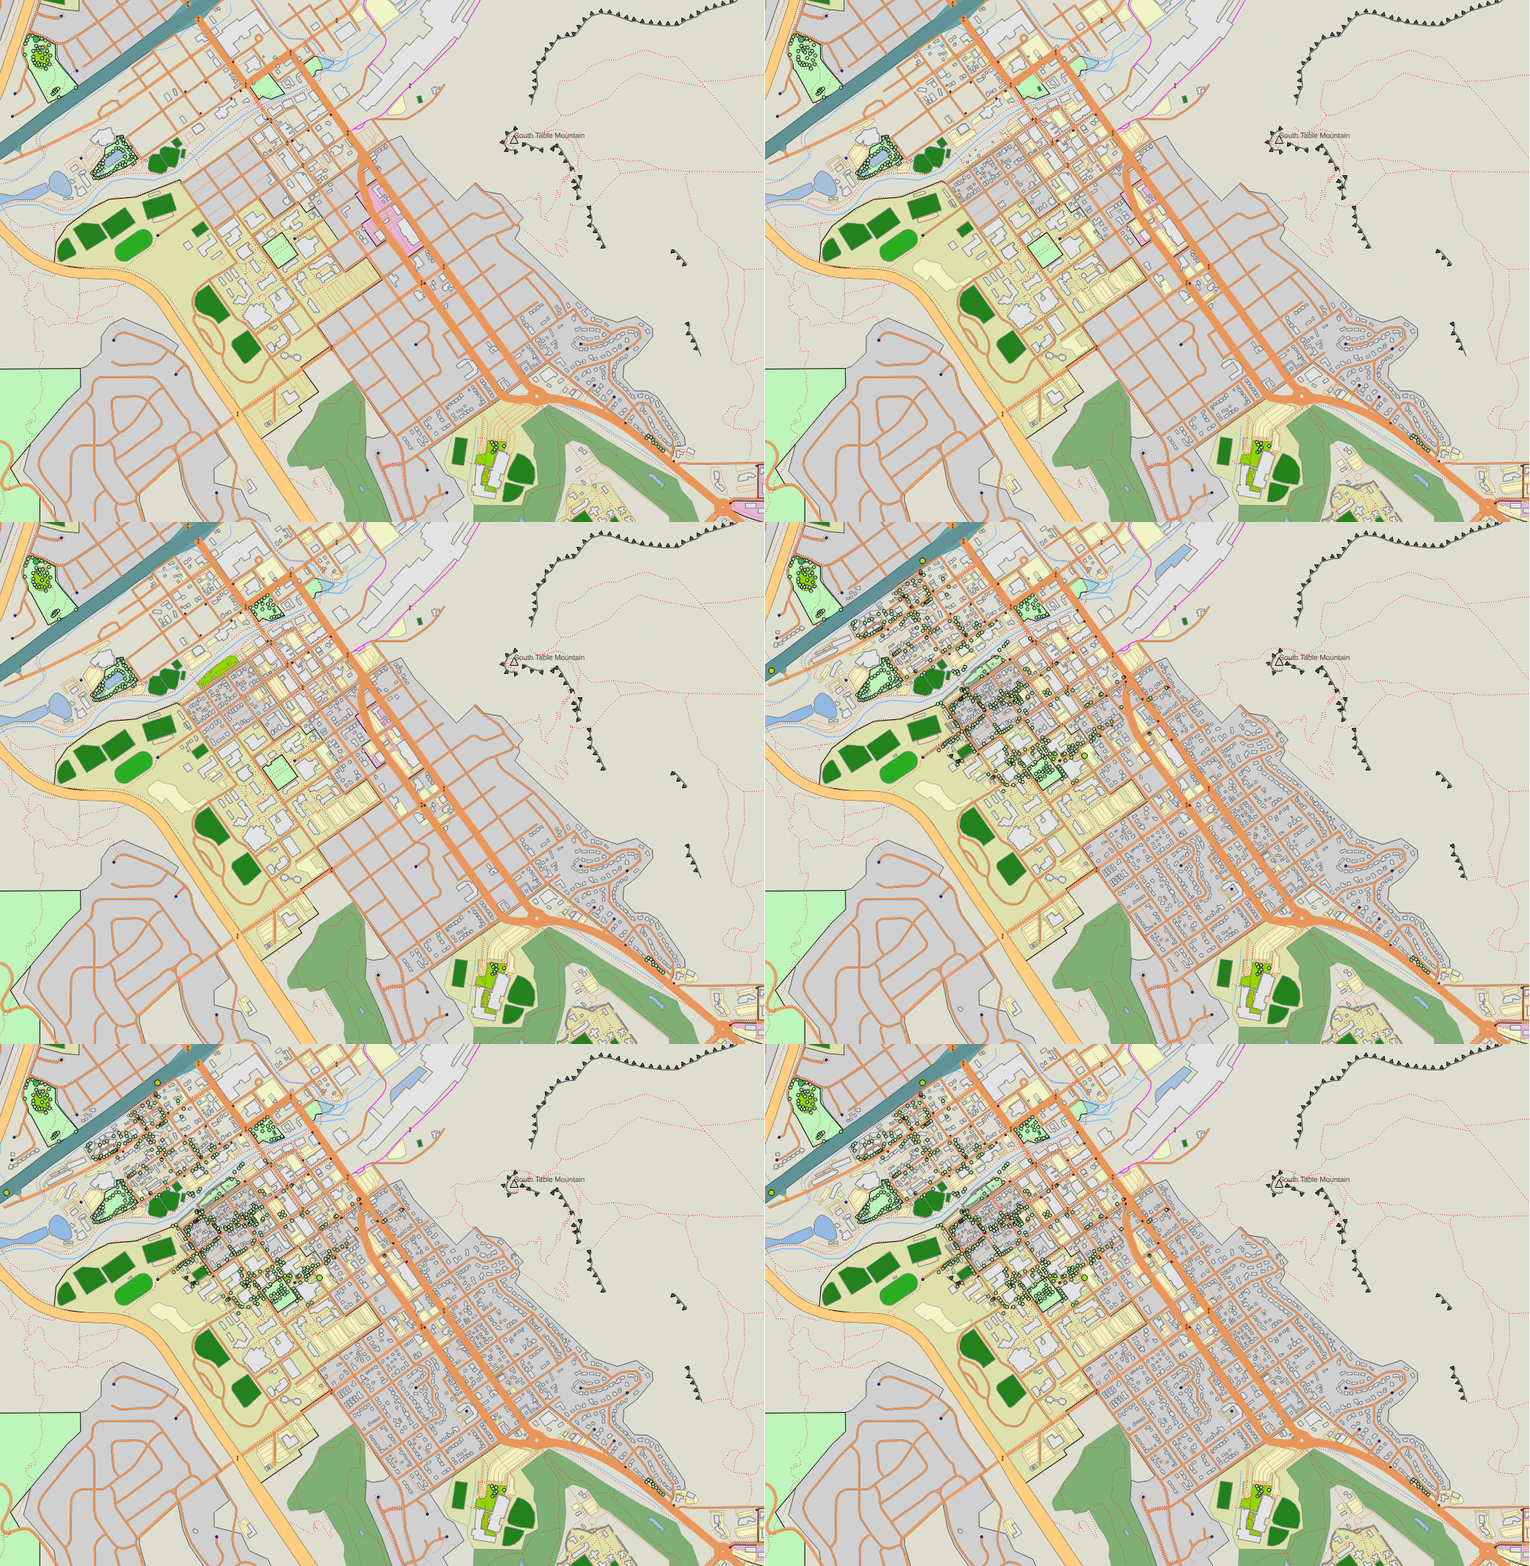
The main goal of this post is to visualize the incredible impact our team of volunteers had on the data for our local community. I also want to discuss a few reasons why I think OpenStreetMap is such a valuable project. Before I go on, check out the first time lapse showing how the data in Golden has improved. Feel free to take your time and really watch how the map has improved in various areas.
All data used throughout this post is © OpenStreetMap Contributors.
Warning: The images in this post are not intended for mobile devices. They are intentionally large!
Golden - November 2015 to April 2016

What the Time Lapse Shows
The time lapse above shows a wide view of Golden, with the area our mapping party targeted towards the top left. Each time lapse (the one above and two below) shows a progression of OpenStreetMap data starting in November 2015 and ending in April 2016, with the final snapshot taken a few days after our event.
In the months before the mapping party you might notice that I was adding as many building outlines as possible. From our last event I learned that it can be difficult for volunteers new to surveying to properly orient themselves without the help of seeing where the buildings are. So, the first obvious improvement from hosting a mapping party is that I work like crazy to prepare the area to make it easier for inexperienced surveyors. Making it easy is a key part to our events, because I want to encourage anyone and everyone to participate, regardless of prior experience or knowledge.
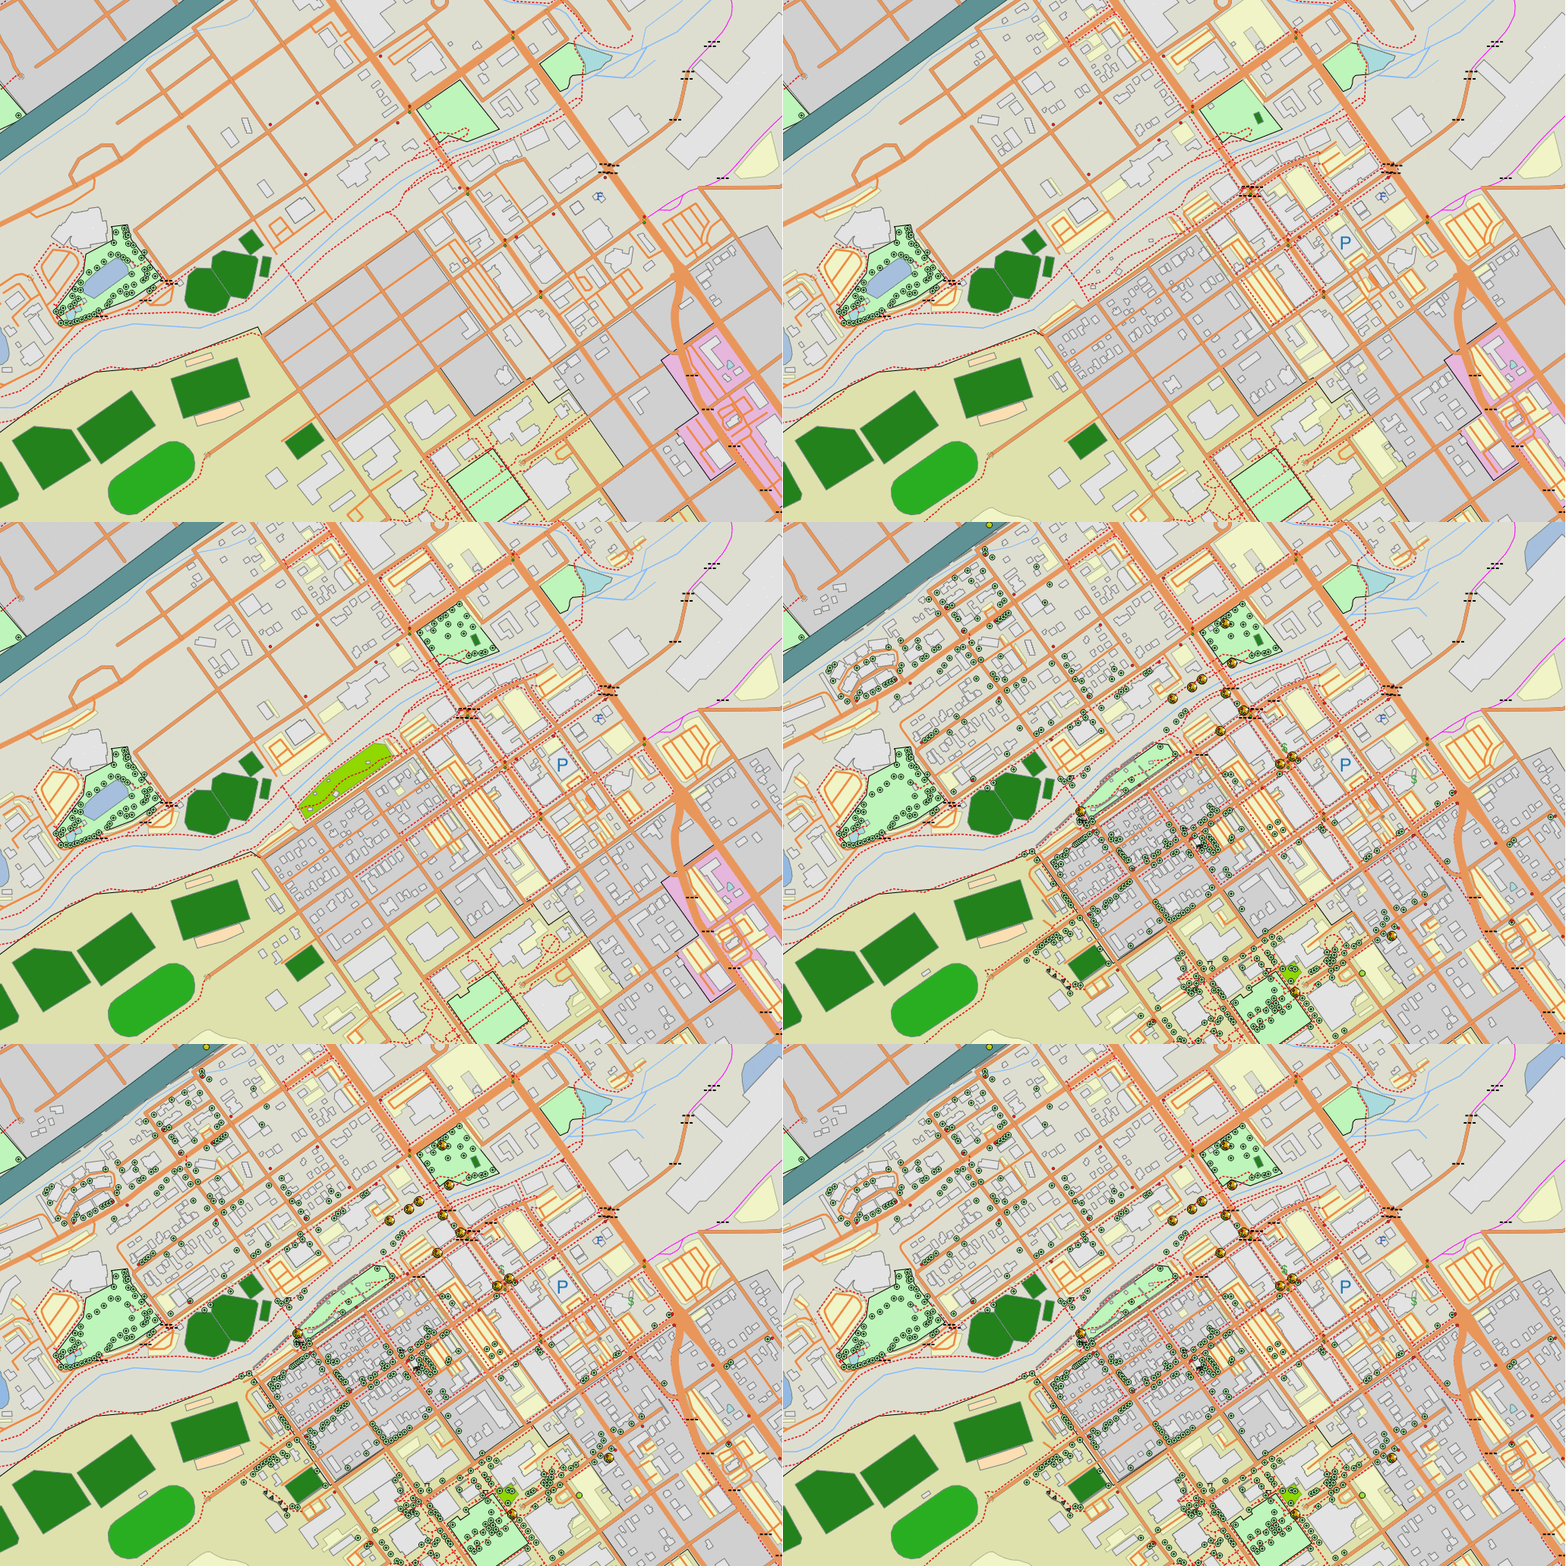
Now let's zoom in a bit and focus in on the area of Golden that our volunteers were targeted in.
Target Area - November 2015 to April 2016

Mapping Party Impact
The above series is focused in on the areas we targeted during our mapping party. Of our 14 volunteers, 12 of them were sent out roaming the streets in 6 different groups. These groups covered roughly 30 city blocks and collected over 1,500 data points. Aside from the new elements that we collected, much of the data collected was simply modifying/improving existing data. An example of that is when street addresses are added to building outlines that were already on the map.
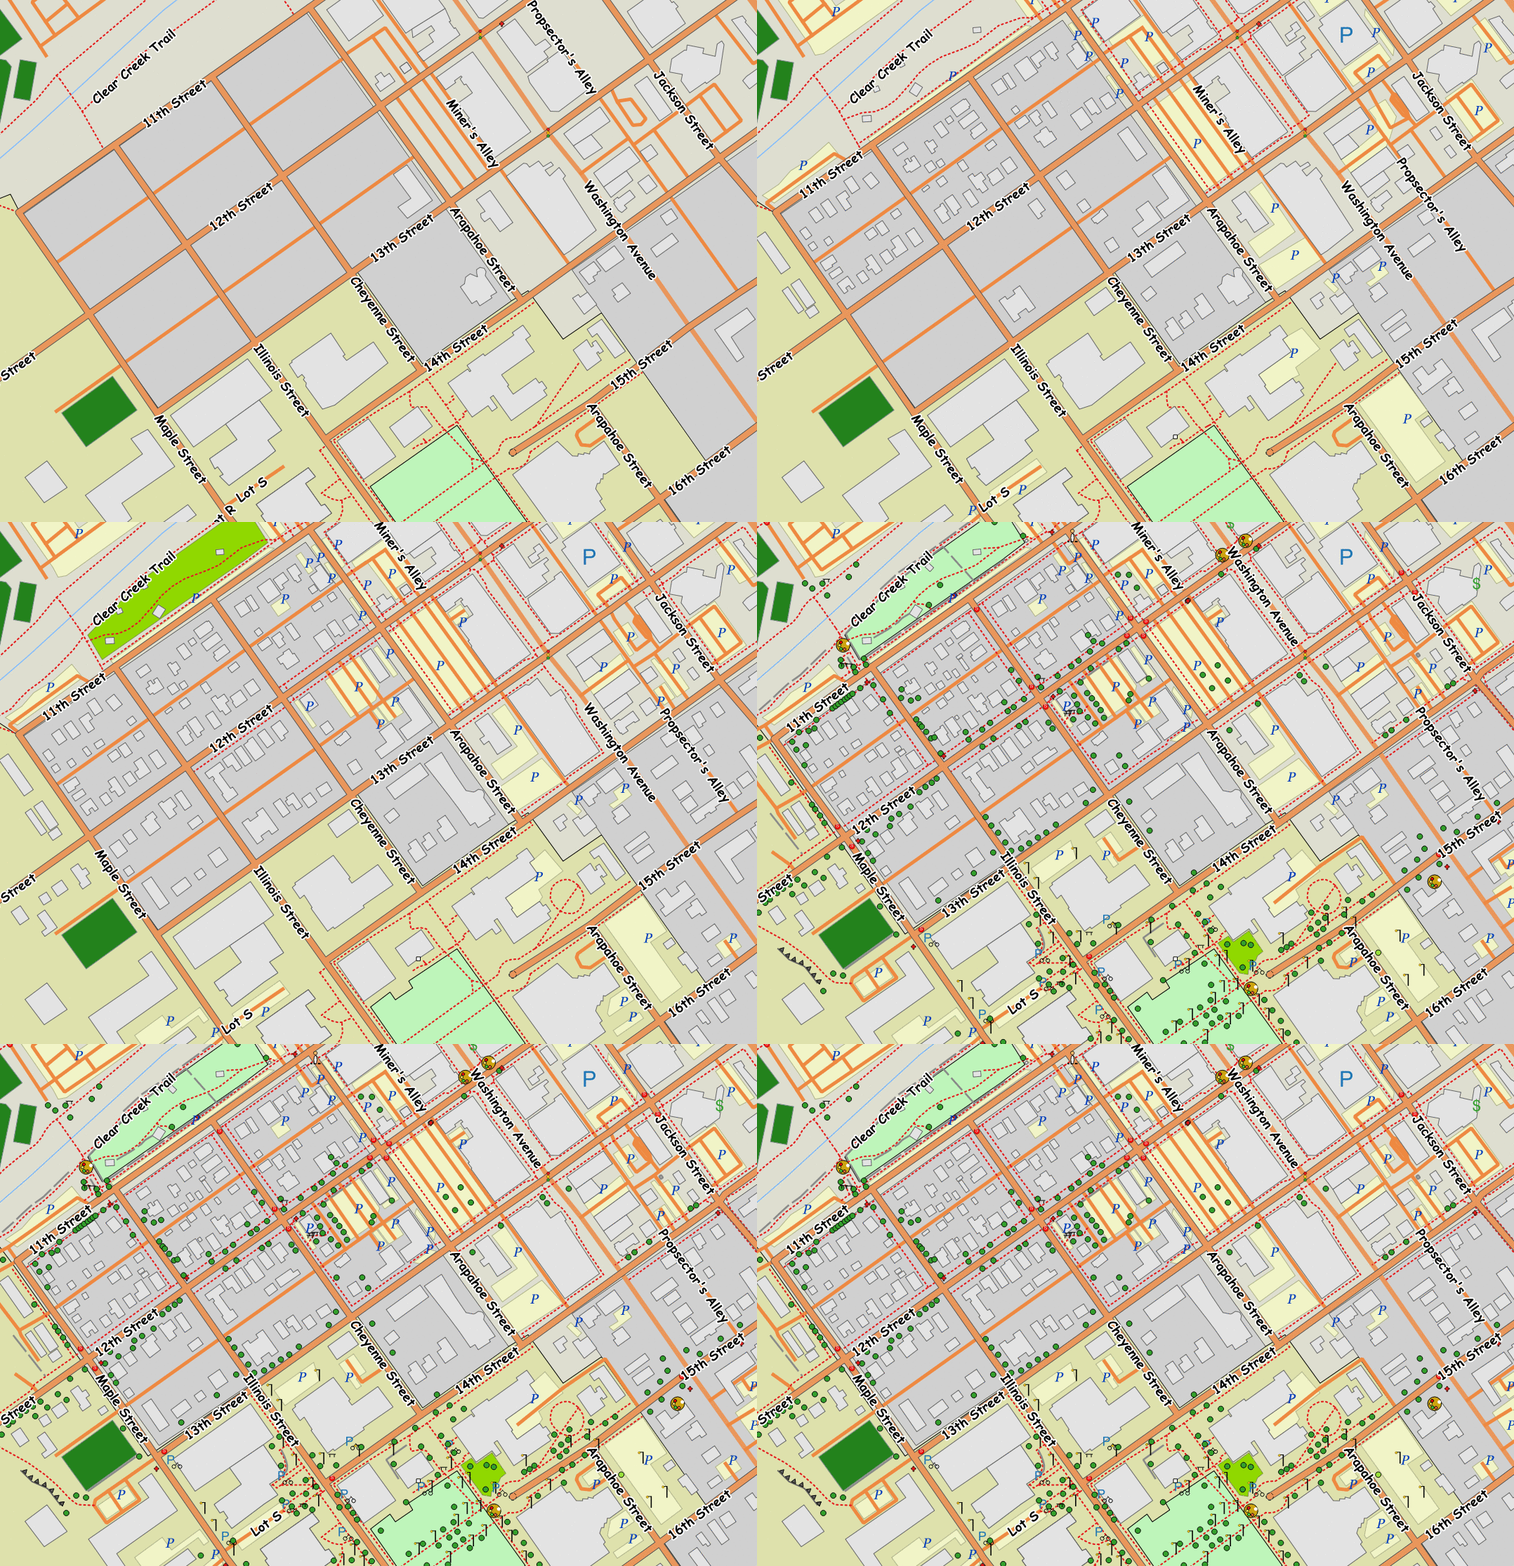
For the final time lapse let's zoom in even further. This one shows a few more details that aren't visible when zoomed further out, such as street lamps, stop signs and fire hydrants. One thing I found interesting was watching how the street name labels are forced to move around as more details are added to the map.
Close View - November 2015 to April 2016

Data Showing OSM Growth in Golden, CO
With the visualizations behind us, now for some raw data for those who are interested. The table below shows the number of a few types of objects included in the map data. For this I picked three points in time: November 2015, February 2016, and April 2016 (after the party). The data elements listed are a few of the common elements we collected during the mapping party.
Note: Data represents objects that are within the city limits of Golden.
| Data Element | Nov. 2015 | Feb. 2016 | Apr. 2016 |
|---|---|---|---|
| Building Outlines | 1,049 | 1,283 | 1,890 |
| Buildings w/ Addresses | 112 | 114 | 205 |
| Fire Hydrants | 48 | 48 | 83 |
| Stop Signs | 42 | 42 | 78 |
| Street Lamps | 115 | 115 | 212 |
| Trees | 298 | 318 | 743 |
| Artwork | 0 | 0 | 13 |
The above table shows how much of an impact a small group of volunteers can have. Note that I'm not claiming that our group was responsible for all of the additions. In fact, I know we aren't! But, we did make a pretty significant spike in activity.
So... Why OpenStreetMap?
As I've talked to hundreds of people about OpenStreetMap and the three most common questions I hear are:
- What's wrong with
insert popular online map hereMaps? - Wait, anyone can edit it? How can you trust it?
- You're really tracking trees?
Starting with other popular mapping services, I'll just refer you to this post which already does a stellar job of explaining the topic. OpenStreetMap has a page on their Wiki dedicated to the topic too.
Trusting the Work of a Community
OpenStreetMap has a page discussing the topic of accuracy and another page discussing completeness where they say "the map can never be complete." Thinking about a map that is never complete, do you know of anywhere that your favorite map isn't accurate? If you live in a new sub-development, or in an area that undergoes frequent construction I can guarantee you that the commercially driven products can't keep up. I know of two round-abouts that have been in place for at least 5 years that OpenStreetMap has accurately, but other maps do not. With a community driven map, all it takes is one person in the local area to keep up with those occasional, yet ongoing, changes.
Another concern with accuracy that I hear is the prospect that a malicious user can vandalize the database. OpenStreetMap has a page on that too! In a nutshell:
"OpenStreetMap is a not-for-profit good cause, and the map data is "owned by" the community. On the whole people tend to have respect for that."
-- OpenStreetMap Wiki
Also, just to be clear, commercial maps can be hacked too. Just sayin'.
Trees? (And Other Obscure Elements?)
Yes, I add trees all over the place. I don't make any attempt to map every tree, but I try to get them on the map when they're significant. One example of significant trees is at a college campus where I believe the aesthetics of the campus environment is improved by the trees. I also track picnic tables, waste baskets, and doors (entrances and emergency exits) on public buildings. This goes back to it being "our" map. I add what I think is important on a map. Everyone else adds what they think should be there. Together, it's ours.
Other Reasons
There are plenty of reasons for Why OpenStreetMap. It's even been called the Most Important Thing in Geo. For me, the best part is that by collecting data for OSM ensure that I continue to get outside and away from my laptop and continue to explore the amazing world around me.
The Humanitarian OpenStreetMap Team (HOT) is another stellar example of how community can come together and make a huge impact. Read about the response that rallied after the 2015 earthquake in Nepal; it's quite impressive. No single corporate entity has this agility to react when the immediate need arises.
Final Thoughts
With another successful mapping behind us, I'm excited to start planning the next one, likely to be scheduled for October 2016. I enjoy the community, meeting new people, and building excitement about OpenStreetMap. If you're interested in receiving notifications about upcoming events as they are announced, please Contact Us and mention that you want to be added to our distribution list!
Happy Mapping!
