Colorado Unemployment: Making the Maps
Earlier this month I wrote about a few different software options for GIS related needs. In this post I will give a high-level overview of how I used PostGIS and TileMill to make the maps for the video below. The video shows the unemployment rate for the state of Colorado by county for the years 2000 through 2013.
Watch the video, then if you're interested in the technology behind it you can read on to find out how it was made!
Overview
I keep all of my spatial data in PostGIS enabled databases using PostgreSQL 9.4. The maps were generated using TileMill with styling done using CartoCSS. The individual maps for each year were exported as PNG from TileMill. I wrote a quick Flask app in Python to loop through the images and to show the legend, since legends can't be exported in PNG format from TileMill. The video was made using QuickTime's built in screen recorder as I looped through the years in my browser.
I will show some of the code used, but installing and configuring these systems, and some of the other nitty-gritty details are beyond the scope of this post.
The shapefiles for the counties came in a national file from the Census Bureaus's TIGER data system. I used the 2014 shapes. The unemployment data is ultimately sourced from U.S. Bureau of Labor Statistics, but I downloaded the data set available at Kids Count Data Center because it was in exactly the format I wanted. (Look for a link that mentions "raw data") These two data sources were joined together for these maps.
Loading the Data
After downloading and extracting the TIGER shapefile from the Census Bureau, I used the ogr2ogr tool to ensure it's it the format I commonly use, WGS1984 (SRID 4326).
Remember: Shapefiles consists of a minimum of three (3) files with the same base name and different extensions.
The command below creates a new set of files with the _wgs84 text in their names so I can be certain they're in the format I need.
ogr2ogr -t_srs EPSG:4326 tl_2014_us_county_wgs84.shp tl_2014_us_county.shp
Next, is to load the converted data to a table in the PostGIS enabled PostgreSQL database. The command below will load the shapefile I created above to a table named "tl_us_county" in the geodb database. Notice that I have '-W "latin1"' to force the table encoding to Latin1. A common issue I've ran into with spatial data is that it won't store properly in the default UTF-8 encoding but latin1 always seems to work ok for me.
shp2pgsql -I -s 4326 -W "latin1" tl_2014_us_county_wgs84.shp tl_us_county | psql -d geodb
Now for the unemployment data, I downloaded and extracted the bulk data from Kids Count Data Center. I created a table to store the data and then used the COPY command in PostgreSQL to load the data.
CREATE TABLE co_unemp_raw
(
    Location VARCHAR(100) NULL,
    TimeFrame CHAR(4) NULL,
    DataFormat VARCHAR(10) NULL,
    Data NUMERIC(4,2) NULL
);
COPY co_unemp_raw FROM '/home/user/data/Unemployment rate by county.csv' DELIMITER ',' CSV HEADER;
With the two source tables loaded in the database, all that's left is to join them in a way so that TileMill can easily retrieve the data. Luckily, both tables have the same distinct county names and so I can use that field to join the data together. The c.statefp = '08' clause filters the county shapefiles to only Colorado since we're the 8th state alphabetically. I'm not sure that code is completely standardized, but it seems to be consistent in most of the U.S. data I've worked with so far.
CREATE TABLE co_unemp_by_year AS
SELECT row_number() OVER () AS id, c.name AS county_name,
        c.geom,
        u.timeframe, u.data AS unemp_rate
    FROM tl_us_county c
    INNER JOIN co_unemp_raw u ON c.name = u.location
    WHERE c.statefp = '08'`
Making the Maps
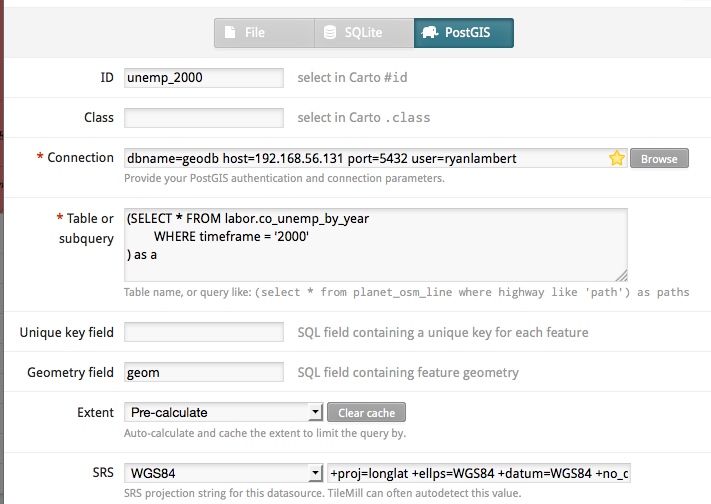
Now that the data has been loaded, it's time to start formatting the maps. In TileMill: I click Add Layer, select the PostGIS tab and set it up like the screenshot below. You'll see in the query that I'm using the WHERE clause to filter for the year 2000, and that I'm putting the year as part of the layer's ID. So as I add new layers for the other years, I only need to change the layer ID and the WHERE clause.

Last I add one more layer that I will use for the text labels on the map, the only difference is the query does a SELECT DISTINCT to get the unique county names and shapes.
SELECT DISTINCT county_name, geom FROM labor.co_unemp_by_year
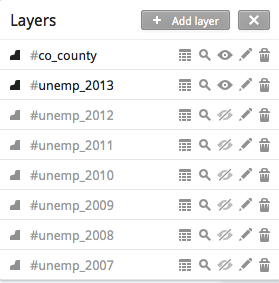
With all 15 layers added (14 years of unemployment data, and the layer for the labels) it might seem a bit obnoxious and cluttered, but I haven't found a better way to do this yet. At this time I only have two layers active at a time: the layer with the text labels and only one of the unemployment layers. Here's part of my Layers menu, notice the two active layers and all the inactive ones (the crossed out eyeball and lighter text indicates the layer isn't visible):

Formatting the Display
The last major step is to format the display using CartoCSS. I used the site 0to255.com to help come up with the shades of red that I used. The first block of CartoCSS defines the colors I used throughout the rest of the stylesheet.
@bg-color: #f1f7f9;
@rng_lt3: #fff4f4;
@rng_3_5: #ffb0b0;
@rng_5_7: #ff7d7d;
@rng_7_9: #ff0606;
@rng_9_11: #c10000;
@rng_11_13: #8e0000;
@rng_13_15: #6c0000;
@rng_gt15: #4a0000;
The rest of the stylesheet handles the main styling itself. First comes the map background, followed by one singular block to style all of the unemployment layers for the different years. (note the commas "," between the ids)
Map {
    background-color: @bg-color;
}

#unemp_2000, #unemp_2001, #unemp_2002,
#unemp_2003, #unemp_2004, #unemp_2005,
#unemp_2006, #unemp_2007, #unemp_2008,
#unemp_2009, #unemp_2010, #unemp_2011,
#unemp_2012, #unemp_2013, #unemp_2014 {
    line-color:#353635;
    line-width:0.5;
    polygon-opacity:1;
    [unemp_rate<3] {
        polygon-fill:@rng_lt3;
    }
    [unemp_rate<3] {
        polygon-fill:@rng_lt3;
    }
    [unemp_rate >= 3][unemp_rate < 5] {
        polygon-fill:@rng_3_5;
    }
    [unemp_rate >= 5][unemp_rate < 7] {
        polygon-fill:@rng_5_7;
    }
    [unemp_rate >= 7][unemp_rate < 9] {
        polygon-fill:@rng_7_9;
    }
    [unemp_rate >= 9][unemp_rate < 11] {
        polygon-fill:@rng_9_11;
    }
    [unemp_rate >= 11][unemp_rate < 13] {
        polygon-fill:@rng_11_13;
    }
    [unemp_rate >= 13][unemp_rate < 15] {
        polygon-fill:@rng_13_15;
    }
    [unemp_rate >= 15] {
        polygon-fill:@rng_gt15;
    }
}
The last thing to style is the layer with county names for labels on the map. This layer won't have any lines, polygons or shading along with it, only the text. This is very basic labeling for now, but it gets the job done.
#co_county {
    text-name: [county_name];
    text-face-name: "Century Schoolbook L Italic";
    text-size: 11;
}
Making the Video
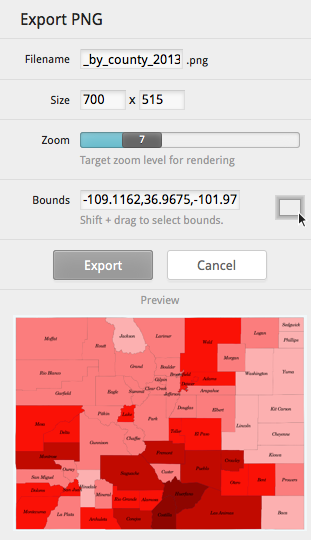
All that is left at this point is to make the video itself. I exported one PNG file for each year by ensuring that year's layer was the only active unemployment layer, then used the Export dialog in TileMill. It took a bit of experimenting to find the output size and zoom that looked "best" and I think I found an ok setting for now.

Once I had the raw images, I worked up a quick app in Flask to handle looping through the images on a timer and displaying the HTML legend. I'm not sharing that piece right now because it's worked in with another, larger project, and is far out of scope of this post. Honestly, it would probably be easier to work up a slideshow in PowerPoint on a timer than it was to do it my way.
Post Mortem
I've had a lot of fun working on this project, and hopefully you will see more like this from me in the future. Now that I have more experience with both PostGIS and TileMill, here are my experiences.
PostGIS
PostGIS is now my favorite system for storing spatial data. The power of spatial analysis directly in my RDMS is amazing. Being able to filter spatial data by using WHERE ST_Contains(a.geom, b.geom) is crazy-cool and beats the pants off any other way of filtering spatial data. Being able to edit spatial data in BULK in a system designed to manage data is also far faster than I can manage when the data is stored in either shapefiles or geodatabases. Yup, I'm a fan of "traditional" databases for a lot of very good reasons.
On the downside, it isn't necessarily easy. PostgreSQL on it's own has a steeper learning curve than other RDMSs, such as MySQL or even MS SQL Server, so if you don't already know PostgreSQL that element must be factored in.
Next, PostGIS isn't straightforward either. The biggest headache I had was when I was missing the "always packaged with PostGIS component" called "shp2pgsql". I looked and looked and looked and the program wasn't anywhere to be found, and I DID have PostGIS 2.1.5 installed! Everywhere I looked just said that if you have PostGIS installed, then you by default have shp2pgsql. Not entirely true... If you have PostGIS AND the PostGIS utilities installed... then it's true!
TileMill
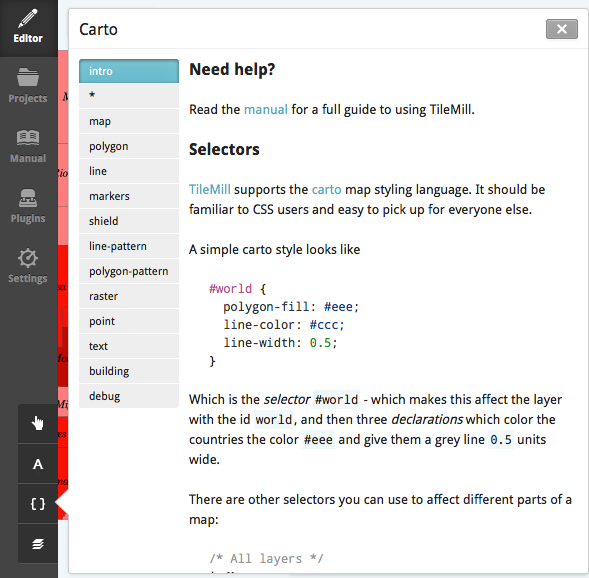
I think TileMill is an example of really great software. It still has some kinks in it, and some minor features missing, but overall has hit the mark right on. While it isn't quite as snappy as QGIS, it does still feel very responsive. I really love formatting the maps via CartoCSS instead of being forced to use a clunky GUI, but again this is a plus to me because I already know and understand CSS. I can imagine that for others this may be a major drawback. Though for anyone who is a bit apprehensive, the designers made a great move by embedding CartoCSS reference directly into the interface so it's easy to see what attributes are available and some common options for configuration.

I noticed that when doing a multiple exports back to back it starts to bog down and becomes a bit unresponsive. That seemed to happen around the 5-7 exports mark, so after every 5 exports I would navigate out to the Projects, and open the project again. This seemed to keep it from getting too hung up, so isn't much more than a minor nuisance.
The last improvement that I wish was in TileMill is a way to discover tables in a PostGIS database with geometry/geography tables. While I'm pretty good at remembering table names and keeping my naming conventions straight... I'm only human and can only remember so much. Since I have to be able to get at my table names, I typically end up with a PgAdmin III window open to jog my memory. Not a big deal... just an "it would be nice" feature.
This post has gotten quite long now so I will leave it at this. If I missed something, or if you have had different experiences I would love to hear about it in the comments!
