Excel and VBA for SQL Server Reporting
Let’s imagine that you have a database that contains some data in it that you want to share. Maybe you’ve inherited a SQL Server database and want to provide some basic reports to other users. Does that scenario sounds somewhat familiar?
Add Data to SQL
If you aren’t interested in creating the test database, feel free to skip this section by scrolling down until you see the chart. My feelings won’t be hurt, I promise!
To create a report in Excel using data in SQL, so we need some data to query against, and before we can have data, we need tables. Let’s create an employee and sales table.
CREATE TABLE dbo.employee
(
    employeeID INT IDENTITY NOT NULL PRIMARY KEY,
    name VARCHAR(200) NOT NULL,
    title VARCHAR(100) NOT NULL
);

CREATE TABLE dbo.sales
(
    salesID INT IDENTITY NOT NULL PRIMARY KEY,
    employeeID INT REFERENCES dbo.employee (employeeID),
    amount NUMERIC (6,2) NOT NULL,
    sale_date DATETIME NOT NULL DEFAULT GETDATE(),
);
Now insert some data. The first part is a straightforward INSERT statement to create the employees of this family ran sales business. The second part loops through and inserts 500 sales records to random employees. Change the @loop variable if you want to add more or fewer records, keep in mind more records will take more time.
INSERT INTO dbo.employee (name, title)
    VALUES
    ('Bob Smith','Sales Manger'),
    ('Jane Smith','Sales Associate'),
    ('Susan Doe','Sales Associate'),
    ('Suzy Salamander','Sales Associate'),
    ('Walker Texas-Ranger','Sales Cowboy'),
    ('John Doe','Sales Associate')
GO

DECLARE @i INT = 0;
DECLARE @loop INT = 500;
DECLARE @employeeID INT;
DECLARE @amount NUMERIC(6,2);

WHILE @i < @loop
BEGIN
    SELECT @employeeID = employeeID FROM dbo.employee ORDER BY NEWID();
    SELECT @amount = (RAND() * 10) + (RAND() * 100) + (RAND() * 150);
    INSERT INTO dbo.sales (employeeID, amount)
        VALUES (@employeeID, @amount);
    SET @i = @i + 1;
END
GO
Query Data
Now we have some data in our sales and employee tables so let’s run a query to get sales by employee.
SELECT e.name, e.title, SUM(s.amount) AS totalSales
    FROM dbo.sales s
    INNER JOIN dbo.employee e
        ON s.employeeID = e.employeeID
    GROUP BY e.name, e.title
    ORDER BY SUM(s.amount) DESC
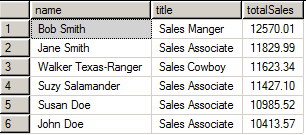
You should see something like the following results, the totalSales will obviously vary.

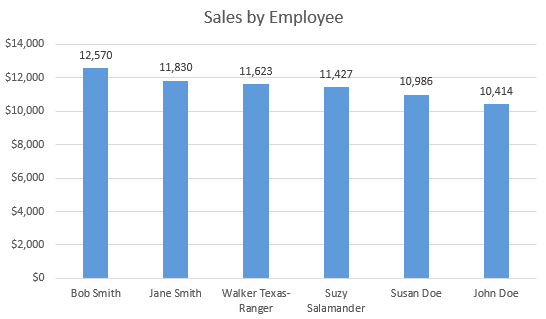
Now you could copy and paste those results in Excel and make a chart off the data manually and you might end up with something that looks like this:

We could do that manually each day, week, or hour that they want the report updated, or we could automate away a lot of that headache.
Manual Processes Suck
I don’t like copying and pasting things. In my opinion, that’s low hanging fruit for automation! Below I include some VBA to help automate reports from SQL. You don’t have to “know” VBA to get this to work, the changes you have to make to the code should be minimal.
In Excel 2007 you now must save the file as a “Macro Enabled Workbook” that gets the file extensions “.xlsm”. You can find this option when you do “File > Save As”. In older versions of Excel they’re still stored in the same .xls files as regular files. To access the VBA editor in any version of Excel hit “Alt + F11″.
Don’t forget References
Because I know we’re going to be using the ADODB library, we need to add that to VBA’s references. This is done in the VBA editor under “Tools > References”. In the dialog that comes up, find and check the “Microsoft ActiveX Data Objects 2.8 Library” then click “Ok”. Without this, VBA will throw an error on the first line that references ADODB.
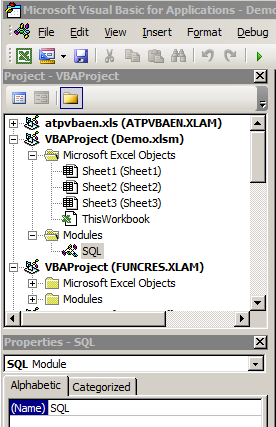
On the left hand side of the VBA editor, Right click on the VBA Project that contains your file’s name in it then select “Insert > Module”. Your “project” now has a module named “Module1″. Rename the module to “SQL” in the name field of the properties pane shown at the bottom of the screenshot.

Now copy and paste the VBA code below into the code editor of your SQL module. Update the values for “db” and “srv” to match your environment. If you don’t know what values to put there, ask your database administrator. This assumes you’re using Windows Authentication to control access to MS SQL Server. Check out the code, I’ll explain after.
Option Explicit

Sub RunQry(dest As Range, SQL As String)

    Dim conn As New ADODB.Connection
    Dim cmd As New ADODB.Command
    Dim rs As ADODB.Recordset
    Dim connString  As String
    Dim db As String
    Dim srv As String

    ' Update the values between the double quotes (" ") to match your database server and name.
    db = "YourDatabaseName"
    srv = "YOURSQLSERVER"

    connString = "Provider=SQLOLEDB;Initial Catalog=" & db & ";Data Source =" & srv & ";Integrated Security=SSPI"
    conn.Open connString
    Set cmd.ActiveConnection = conn

    cmd.CommandText = SQL
    cmd.CommandType = adCmdText
    Set rs = cmd.Execute
    dest.CopyFromRecordset rs

    rs.Close
    conn.Close
    Set rs = Nothing
    Set conn = Nothing

End Sub
The RunQry module accepts two parameters, a Range for the returned data to be stored at and arbitrary SQL code to be executed. It creates an ADODB connection and executes the SQL query passed to the method against the server and database defined. The results from the executed SQL are then pasted at the range defined as a starting point.
Warning: This has potential security implications. Queries must be designed with SQL Injection in mind! Don’t ever pass raw text from the user in as query parameters without sanitizing them first! Ideally users have very limited permissions, and are limited to only executing stored procedures!
Execute our Query from Excel
Now that we have the SQL module with a RunQry, we can call it from other code and simply tell it what query to run, and where to put the data. Create a new module by right clicking on the Modules folder icon and again “Insert > Module” and name this one “main”.
Paste the following VBA code into the main module. Notice that I created a stored procedure in SQL Server to execute the sales by employee query because I hate having multi-line SQL escaped in VBA. This provides a cleaner and more secure approach.
Option Explicit

Sub run_sales_query()
    Dim data_start As Range
    Dim sql_qry As String

    ' Change to clear out the number of rows/columns your data will fill
    Sheet1.Range("A6:C20").Clear

    ' Change to move where data is placed
    Set data_start = Sheet1.Range("A6")

    ' Perfect example of why stored procedures are better for this!
    sql_qry = "EXEC dbo.getSalesByPerson"

    Call SQL.RunQry(data_start, sql_qry)
End Sub
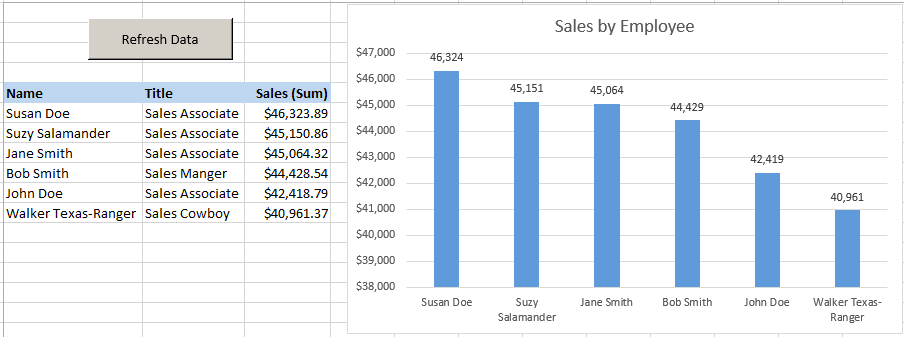
The code pastes the results from our query (without headers) to cell A6 on Sheet1. This will leave room for the Refresh button above the data. I also manually add the headers above the data (row 5) since they don’t come in with the results from SQL.
To test run the report hit “Alt + F8″ and run the run_sales_query macro.
An error that highlights an ADODB line is probably a missing reference! The sql_qry variable can be set to any regular SELECT or EXEC statement that returns data. I recommend always retrieving data from stored procedures, but hey, that’s just me!
SQL Enabled Report
I added a simple button that triggers the run_sales_query module to refresh the data. I can now add to the sales data by running a couple thousand more sales transactions (see the Loop code above) and see the updated report by simply clicking the “Refresh Data” button. Pretty slick!

Final Thoughts
As your reports grow beyond more than one simple query, I find it’s best to have each distinct query going to its own dedicated worksheet to avoid potential overlap of data. Create your various polished reports for display that have links to the raw data worksheets. When the polished reports are ready, the raw data worksheets can be hidden to clean up the file. You can get fancier by providing drop down menus, but that’s beyond the scope of this post.
